


Charleston Real Estate: So, What Kind Of Year Was 2014?
With 2015 upon us, it is time to look back and see how 2014 was for the Charleston real estate market. Here are some numbers from the Charleston MLS. First, a look at closed sales:
First, you will notice that the number of Closed Sales trended up towards year’s end. There were 986 Closed Sales in November, which was down from October. However, that number increased to 1259 in December. It will be interesting to see what happens in the first couple months of 2015. In 2013, the exact same thing happened–sales dipped in November and then rebounded in December, only to drop at the beginning of this year.
Next is a look at Closed Sales over the last few year for comparison:
As you can see, the number of Closed Sales has increased year-over-year once again in 2014. In fact, since 2012 the number of sales in the Charleston Real Estate market has increased by nearly 34% (33.72%)!
With sales numbers up, we need to next look into the values:
The Average Sales Price dropped over the last few months of 2014. It peaked in June at $315,050. It was at $299,166 in October, then dropped to $267,561 in December. In fact, December was the lowest Average Price for all of 2014.
So, how are values compared to the previous years?
Despite the recent decline, overall the Average Sales Price has once again increased in 2014. Since 2012 the Average Sales Price in Charleston has increased by 10.37%.
Not too bad considering that in a “normal” real estate market you see 3%-4% appreciation per year, so that is above the “normal” 6%-8%.
Despite the recent dip in values, overall the numbers are increasing. Each recent year has seen peaks and valleys, especially around the end of one year and the beginning of the next.
However, each year saw the numbers increase over the previous year. This can best be seen in the next graph, which shows the Average Sales Price for the last 3 years:
So, the recent dip doesn’t look that unusual based on the above graph. More of a bump in the road as opposed to a sign of bad things to come.
Two other pieces of information will help us better understand where the current Charleston real estate market is heading into 2015. First, the Average Days On The Market (DOM):
First, that number came down in December, from November’s 80 to 71. As you can see by the graph, that number has been steadily decreasing. Here is a look at year-to-year comparisons:
This one better shows the fact that it is taking less and less time to get sold in Charleston.
The next graph shows the Months Supply Of Inventory for 2014:
Just like the Average DOM numbers, the Months Supply has also been steadily on the decline. For December, the Months Supply was 4.4 months, down from November’s 5 months. Here is a look at the Supply for the last 3 years:
Once again, that number is down in 2014, just as 2013 was down from 2012. The key takeaway from the above graph is the fact that for 2014 the Charleston real estate market is under 6 months Supply. This indicates a sellers market, which means rapid appreciation of values.
Many parts of Charleston have been in a sellers market for much of 2014, but now the overall market average is below the 6 month threshold. That is a very powerful statistic.
So, 2014 was another great year for the Charleston real estate market. It is interesting to compare Charleston with the rest of the nation–this can help us see what could happen for Charleston going forward.
Nationally, the real estate market has seen rapid appreciation over the last couple years, but in 2014 things slowed down some. It is important to make clear the the rate of appreciation slowed, but that number is still increasing. You can see that with this graph:
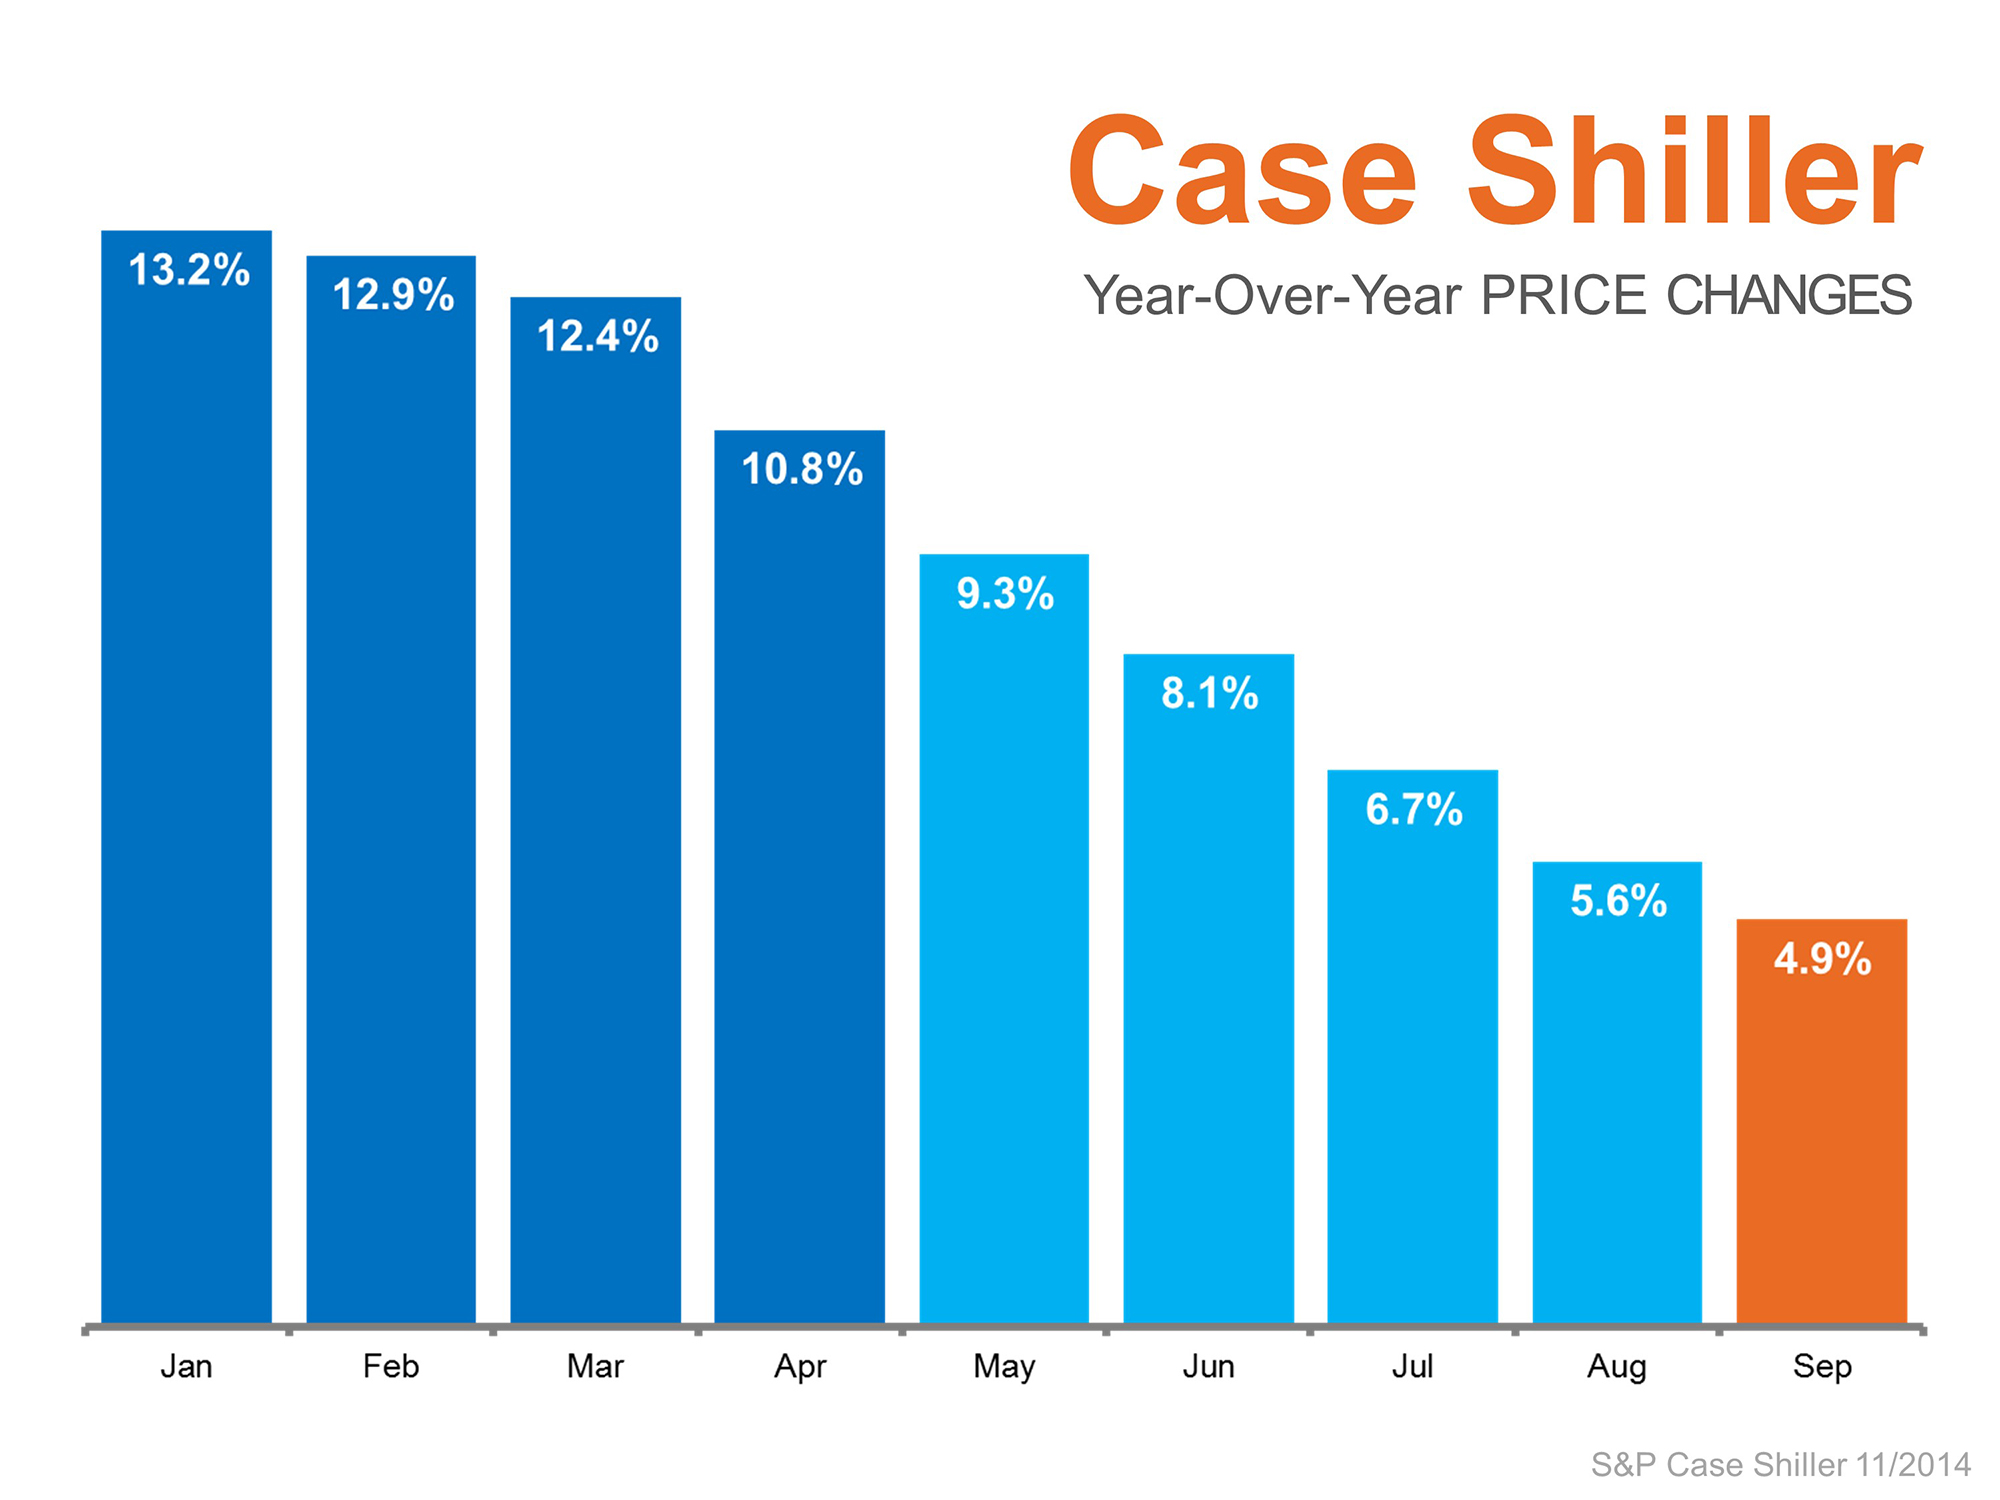 This graph compares each month’s year-to-year price changes for 2014. As you can see, 2014 started off hot–12%-13% appreciation (keep in mind that the “normal” rate is 3%-4%).
But, going towards year’s end, the rate was declining–BUT, the appreciation rate was still increasing.
By looking at the above graph for Charleston showing the Average Sales Price for the last 3 years, you can see something similar:
2013 saw an increase in values (Average Sales Price) of 6.5% over 2012. 2014 also saw an increase over the previous year of 3.7%.
So, 2014 is still up for Charleston home values, but the rate of appreciation has slowed. (Of course, this graph is comparing year-over-year by each year, whereas the Case Shiller graph actually breaks it down by each month of 2014, but you get the idea).
The key thing to learn from this is the national real estate market is slowing down only in rate of appreciation. And this is actually a good thing.
There is one lesson we learned from the market bubble and crash from a few years ago–if the market is gaining at a rapid rate, at some point it will crash.
What is happening nationally is reflected with what is happening locally–the market is normalizing. It is returning to a more normal rate of growth, a healthy rate of growth.
Rapid growth can only be maintained for so long, and eventually the market will correct itself–in the form of crashing.
But, slow and steady wins the race, so now the market is correcting the rapid growth, and settling into something more sustainable over a longer period of time.
This is great news for Charleston buyers and sellers.
If you would like to keep up with the latest stats from the Charleston real estate market, then bee sure to check out my Charleston Real Estate Stats page.
Leave a Reply