


Daniel Island Real Estate: A Look Back At 2014
Today I am looking at the Charleston MLS to see how Daniel Island real estate did in 2014. First, here is a look at Closed Sales:
In December, Closed Sales increased from 20 in November to 32. The peak month in 2014 was both May and June which each saw 37 Closed Sales. January was the lowest month with 15 Closed Sales. You probably notice the drop for January of 2015, which saw 14 Closed Sales.
Is this a bad sign for Daniel Island real estate? If you look at the past few Januarys, you can see that it is not unusual to start off the New Year with a Sales drop:
Here is a look at 2014 sales compared to previous years:
Like many areas of the greater Charleston SC real estate market, 2013 saw explosive growth in Closed Sales. And, also like many areas, there was still growth in 2014, although at a lower rate. Daniel Island still increased the number of Closed Sales from 2013, although it was only one more home some in 2014.
So, how are home values on Daniel Island? Here is a look at the Average Sales Price:
The Average Sales Price dropped to end 2014, from $770,997 in November to $702,460 in December. However, that number has rebounded so far in 2015, up to $773,890. How did 2014 compare to previous years?
For most areas of Charleston, home values exploded in the double digits in 2013, and settled to a more normal rate in 2014. However, Daniel Island took a different trend–a slight dip in 2013, and a double digit increase in 2014.
Next is a look at the Average Days On The Market (DOM):
That number dropped in December, from 78 DOM in November to 60 DOM. That number shot up in January, up to 132 DOM. Is this a bad sign?
Here is a look at 2014 DOM compared to previous years:
The Average DOM dropped in 2014, so that is a good sign. Finally, we need to look at the Months Supply Of Inventory for Daniel Island homes for sale:
That number is dropping–from 3.6 Months Supply in November to 3.2 Months Supply in December, down to 2.8 in January. This is a good sign as it indicates a sellers market.
But the downside of that is that there is not enough supply to meet demand, so this can be a reason Closed Sales are down so far in 2015.
Currently, there are 81 Daniel Island homes for sale. Of that 81, 25 have been on the market for 132 days or more.
Additionally, there are 36 Pending Sales and another 43 homes under contract. Pending Sales tend to predict future sales, as these homes will be closing in 30-60 days.
The homes under contract (Contingent Sales) are under contract but not yet set to close. Not all will make it to the closing table, but they can also indicate future sales.
So, that is 79 homes that could close sometime in the next 3 months. The highest month for sales we saw in 2014 was 37, so we could see some good months for Daniel Island to jump start 2015.
I also noticed that there were 21 new listings in January, so, along with the current 81 listed for sale, that will help meet the demand. However, the demand far outweighs the supply, so that should keep home values on the rise in 2015.
Remember, Daniel Island real estate saw a small drop in values in 2013–opposite of many areas of Charleston. So, is it possible that Daniel Island real estate may see another double digit increase in home values?
Buyers searching for Daniel Island homes for sale should know and understand these numbers and what they mean.
Buying sooner than later will have the increasing home values working for you and not against you.
Buying now means appreciation goes into your pocket. Waiting means homes will cost you more, and you could possibly get priced out of the home you really want.
I shared this graphic in my post yesterday, and it better explains how buyers who wait lose purchasing power.
The example is for a $400,000 home, and shows how rising interest rates work against buyers.
In this graphic, say you want to keep your monthly mortgage payment between $1800/month to $1900/month, and watch what happens as interest rates work against you:
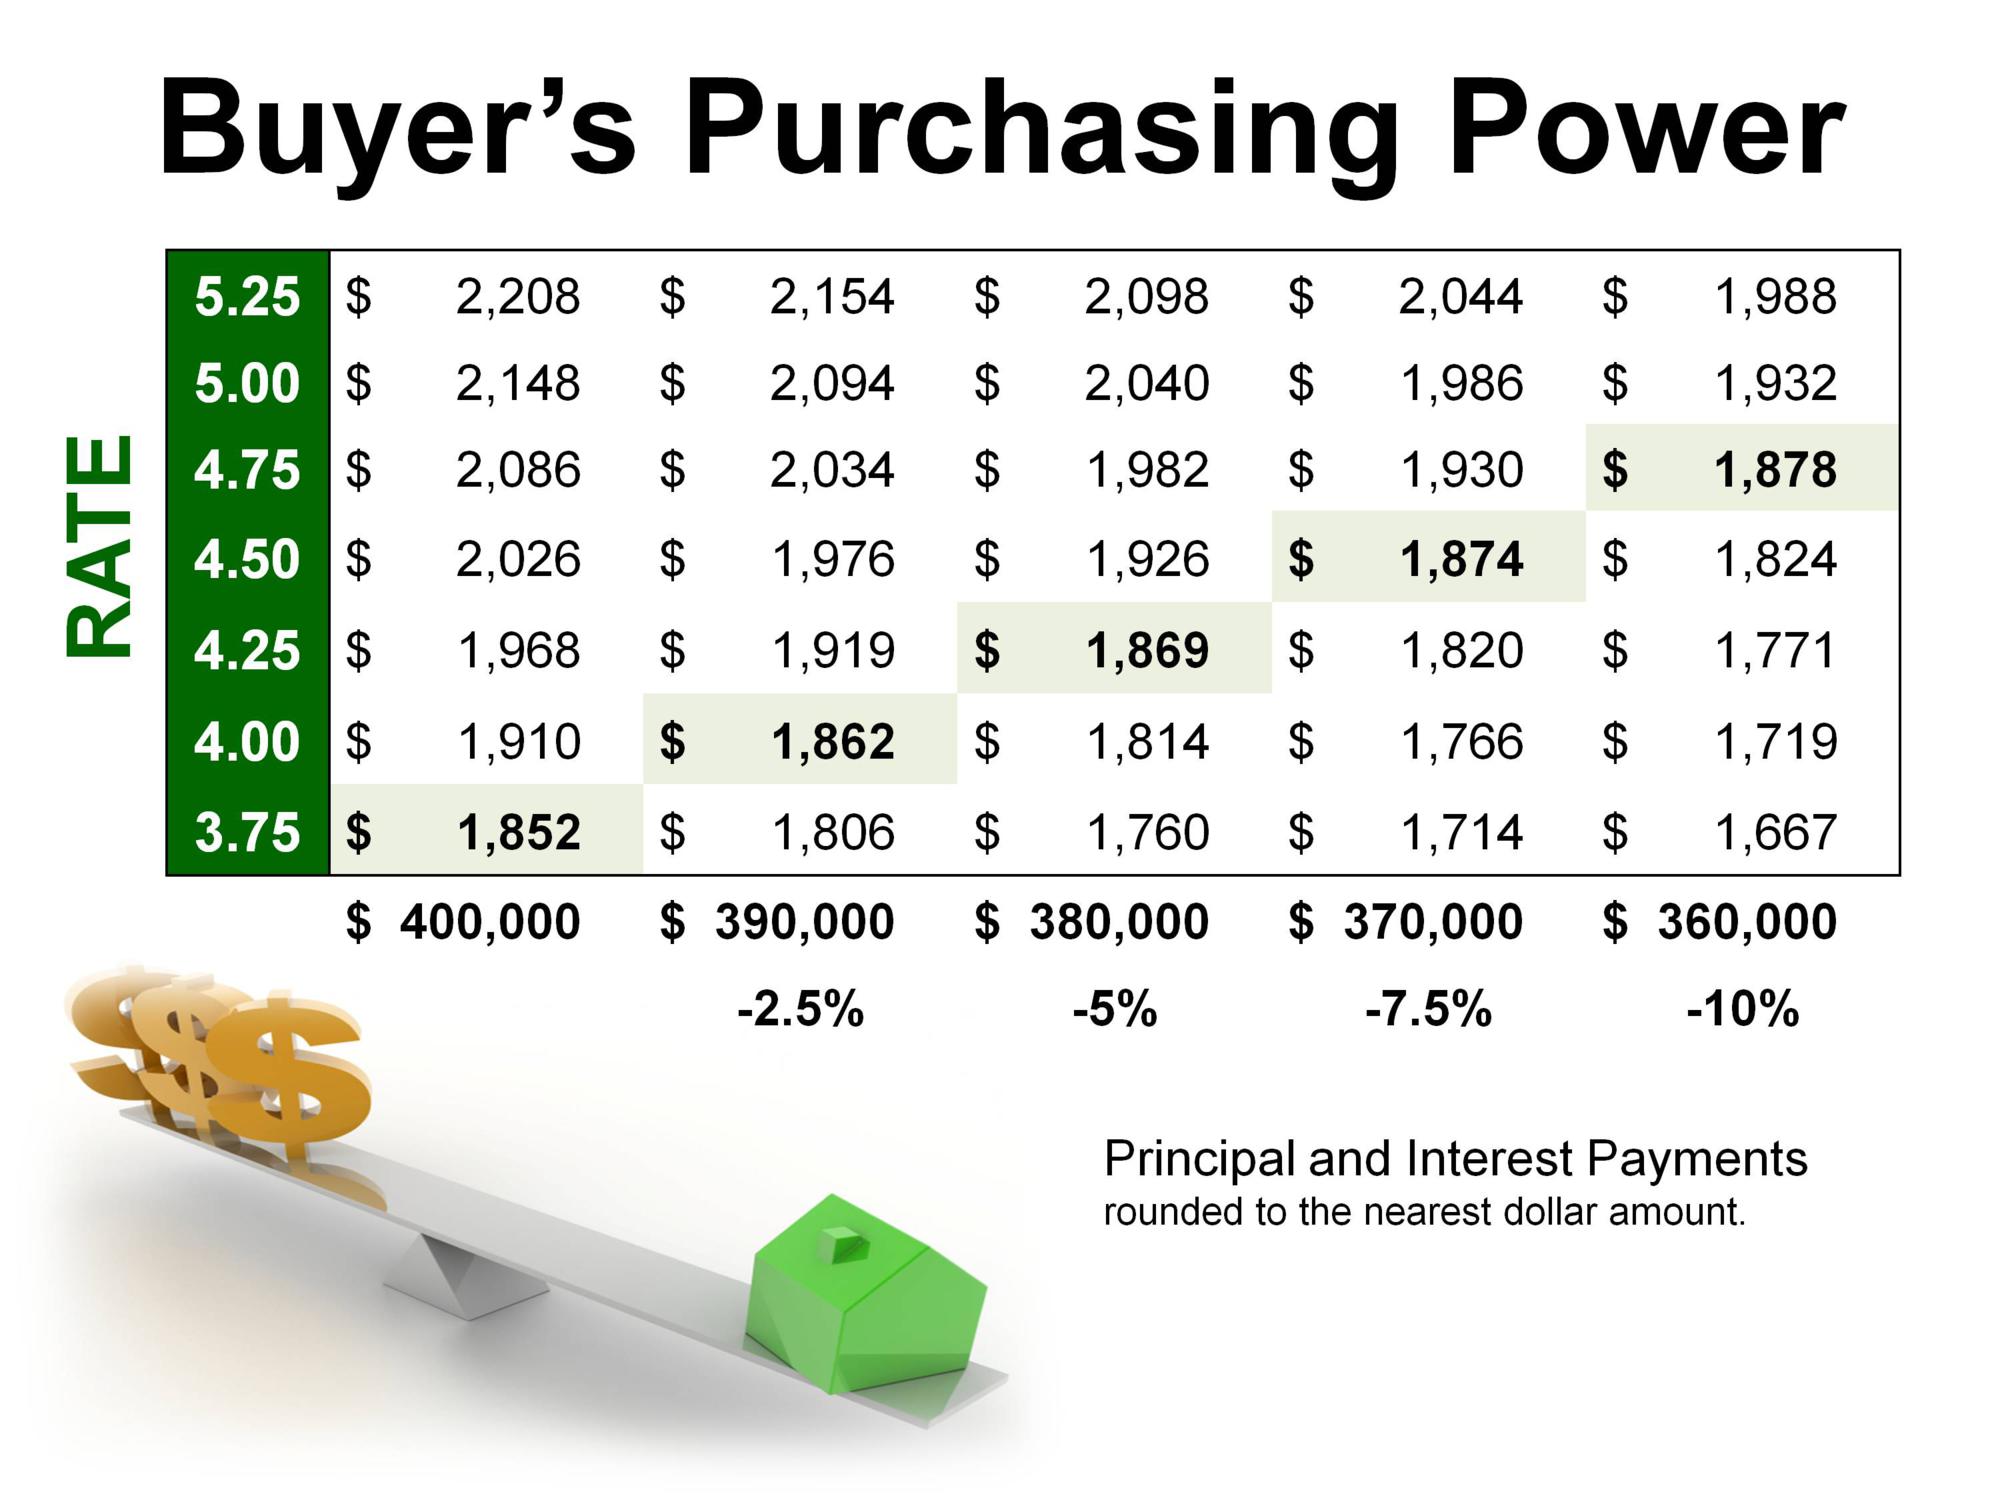
This graphic doesn’t take into account that home values will also be increasing.
A down side to a sellers market for buyers is the possibility of a multiple offer situation. This can be frustrating for buyers, and you do lose some leverage in negotiations.
However, by knowing and understanding the market numbers, you can gain some leverage over some sellers–for instance, any seller that has been listed over 132 days is probably ready to get their home sold. (Not always the case, but an example of how a buyer can use these numbers to their advantage).
For sellers, it is pretty obvious–the demand is there and it isn’t being met. But what about the other 81 Daniel Island homes for sale?
Remember, 25 have been listed for 132 days or more. If you look at the 81 homes, 36 have been listed for over 100 days. Chances are, some, if not all, of these homes are overpriced.
Just because the demand is there does not mean buyers will overpay for a house. It is critical, even in this climate, to price your home correctly from the start.
But another critical component to a successful home sale in having the proper marketing. It is important to hire the right agent that can get your home the exposure it needs in front of these buyers.
If you are searching to buy Daniel Island homes for sale, then bee sure to visit my Daniel Island MLS page–you can sign up for a free list of Daniel Island homes for sale that include prices, addresses, pictures, complete details and a link to Google Maps.
This list is delivered to your inbox and will be updated regularly with new listings.
Sellers should visit my sellers page, and check out my home selling videos.
If you would like to keep up with the latest stats for Daniel Island, then check out my Pam Marshall Realtor website page for Daniel Island real estate.
Leave a Reply