
Homes For Sale In Charleston SC: How Do We Compare With National Numbers?
With home sales looking strong nationally, I thought I would see how homes for sale in Charleston SC compared.
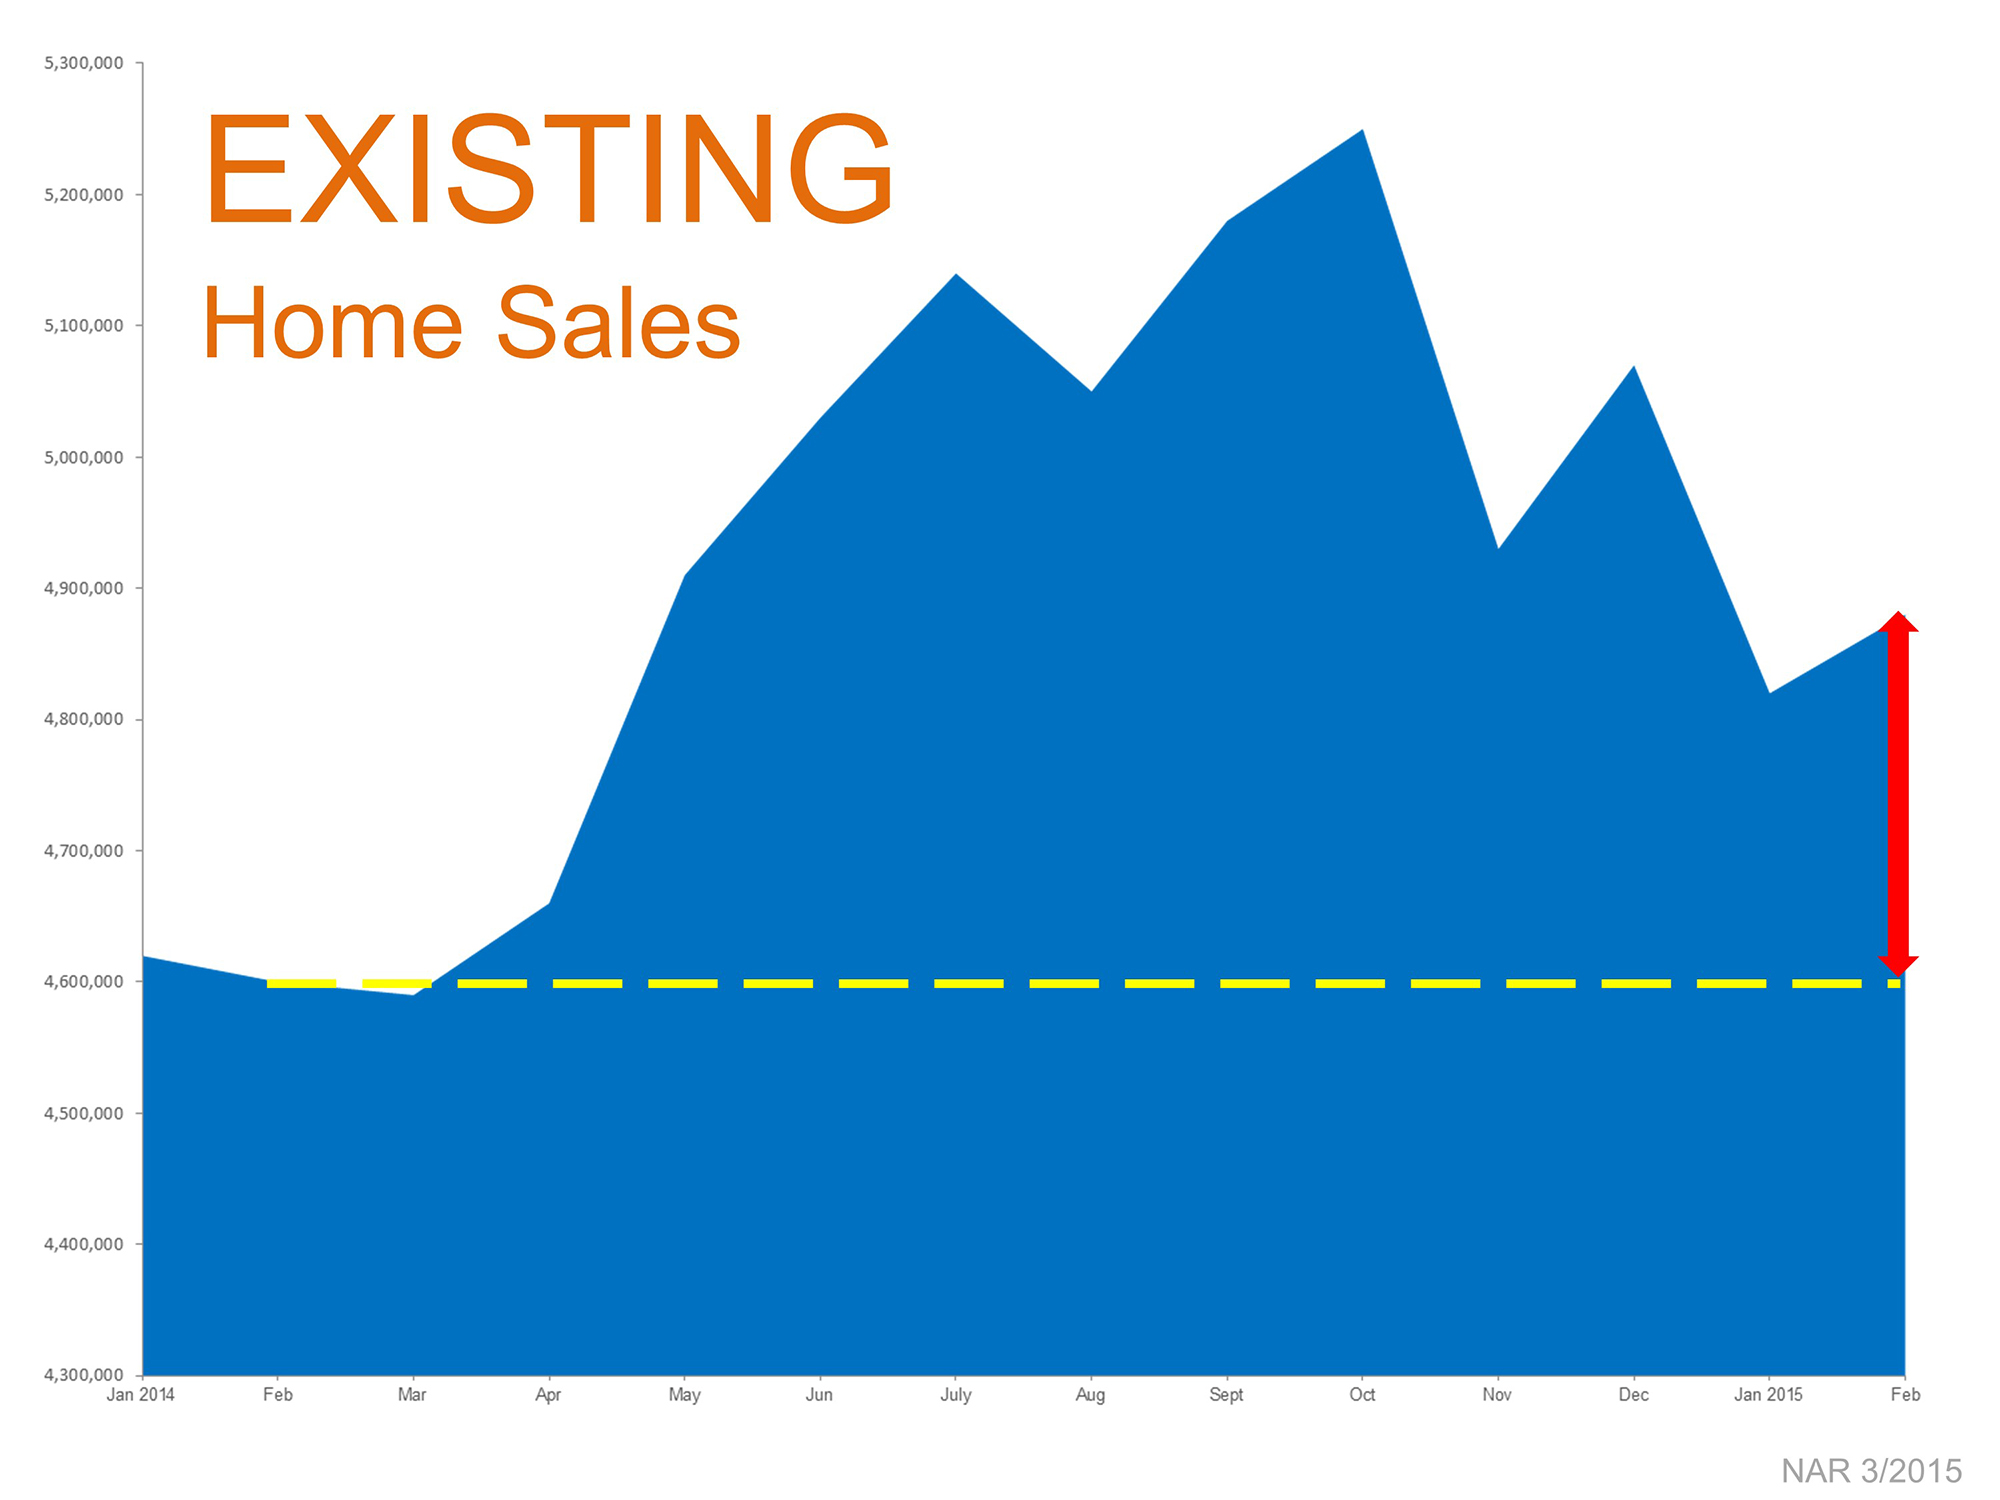
Nationally, homes sales are up, way up above this time last year. Home sales slid during the last few months of 2013. It wasn’t until April of last year that they rebounded and started trending upward.
That isn’t the case in 2015. Buyers are out in full force so far in 2015, and you can see how much better home sales are this year compared to last year.
This time last year, there were roughly 4,600,000 homes sold. This March, roughly 4,900,000. That is an increase of roughly 6.5%.
Over the last couple weeks I have been looking at the latest Charleston MLS numbers, broken down by city.
One common theme I noticed throughout the Charleston SC area: in many cases we have come close to or exceeded 2014 peak numbers already in 2015.
In almost all cases, numbers from within the last year were the best we’ve seen in years–in many cases dating back to 2008, or even 2005.
Some numbers were the best in at least the last 10 years, if not ever.
Here is a look at the entire Charleston MLS for Closed Sales over the last year:
In March, there were 1,430 Closed Sales. Last March there were 1,134. The peak in 2014 was in June with 1,453 Closed Sales.
So, just 3 months into 2015 and we have almost hit last year’s peak.
You also have to consider that we are not yet into our peak selling season.
June 2014 was the most Closed Sales for one month on the Charleston MLS since September 2006 with 1,462 Closed Sales.
Here is another look, comparing the Closed Sales of last March to this March:
In one year, Closed Sales have jumped up 26.1%. Remember, nationally we saw a jump of about 6.5%. There were still 1,134 Closed Sales last March, and we increased that by a quarter.
Some other areas posted nice increases in Closed Sales from March to March as well.
Hanahan real estate saw an 85% increase:
Moncks Corner real estate saw a 53.8% increase:
James Island real estate saw an increase of 133.3%–of course, this is an increase from 3 Closed Sales in March 2014 to 7 Closed Sales in March 2015, but a big increase nonetheless:
Johns Island real estate also had a big jump, 90.5%:
Pretty much every area of Charleston saw an increase from March to March. The one exception was Sullivans Island, which saw Closed Sales drop from 5 last March to 2 this March, a decrease of 60%.
Another number that is up nationally is the number of Pending Sales. In February, we hit the highest number of Pending Sales since June 2013.
Locally, I saw high numbers in February, and in most cases March exceeded February.
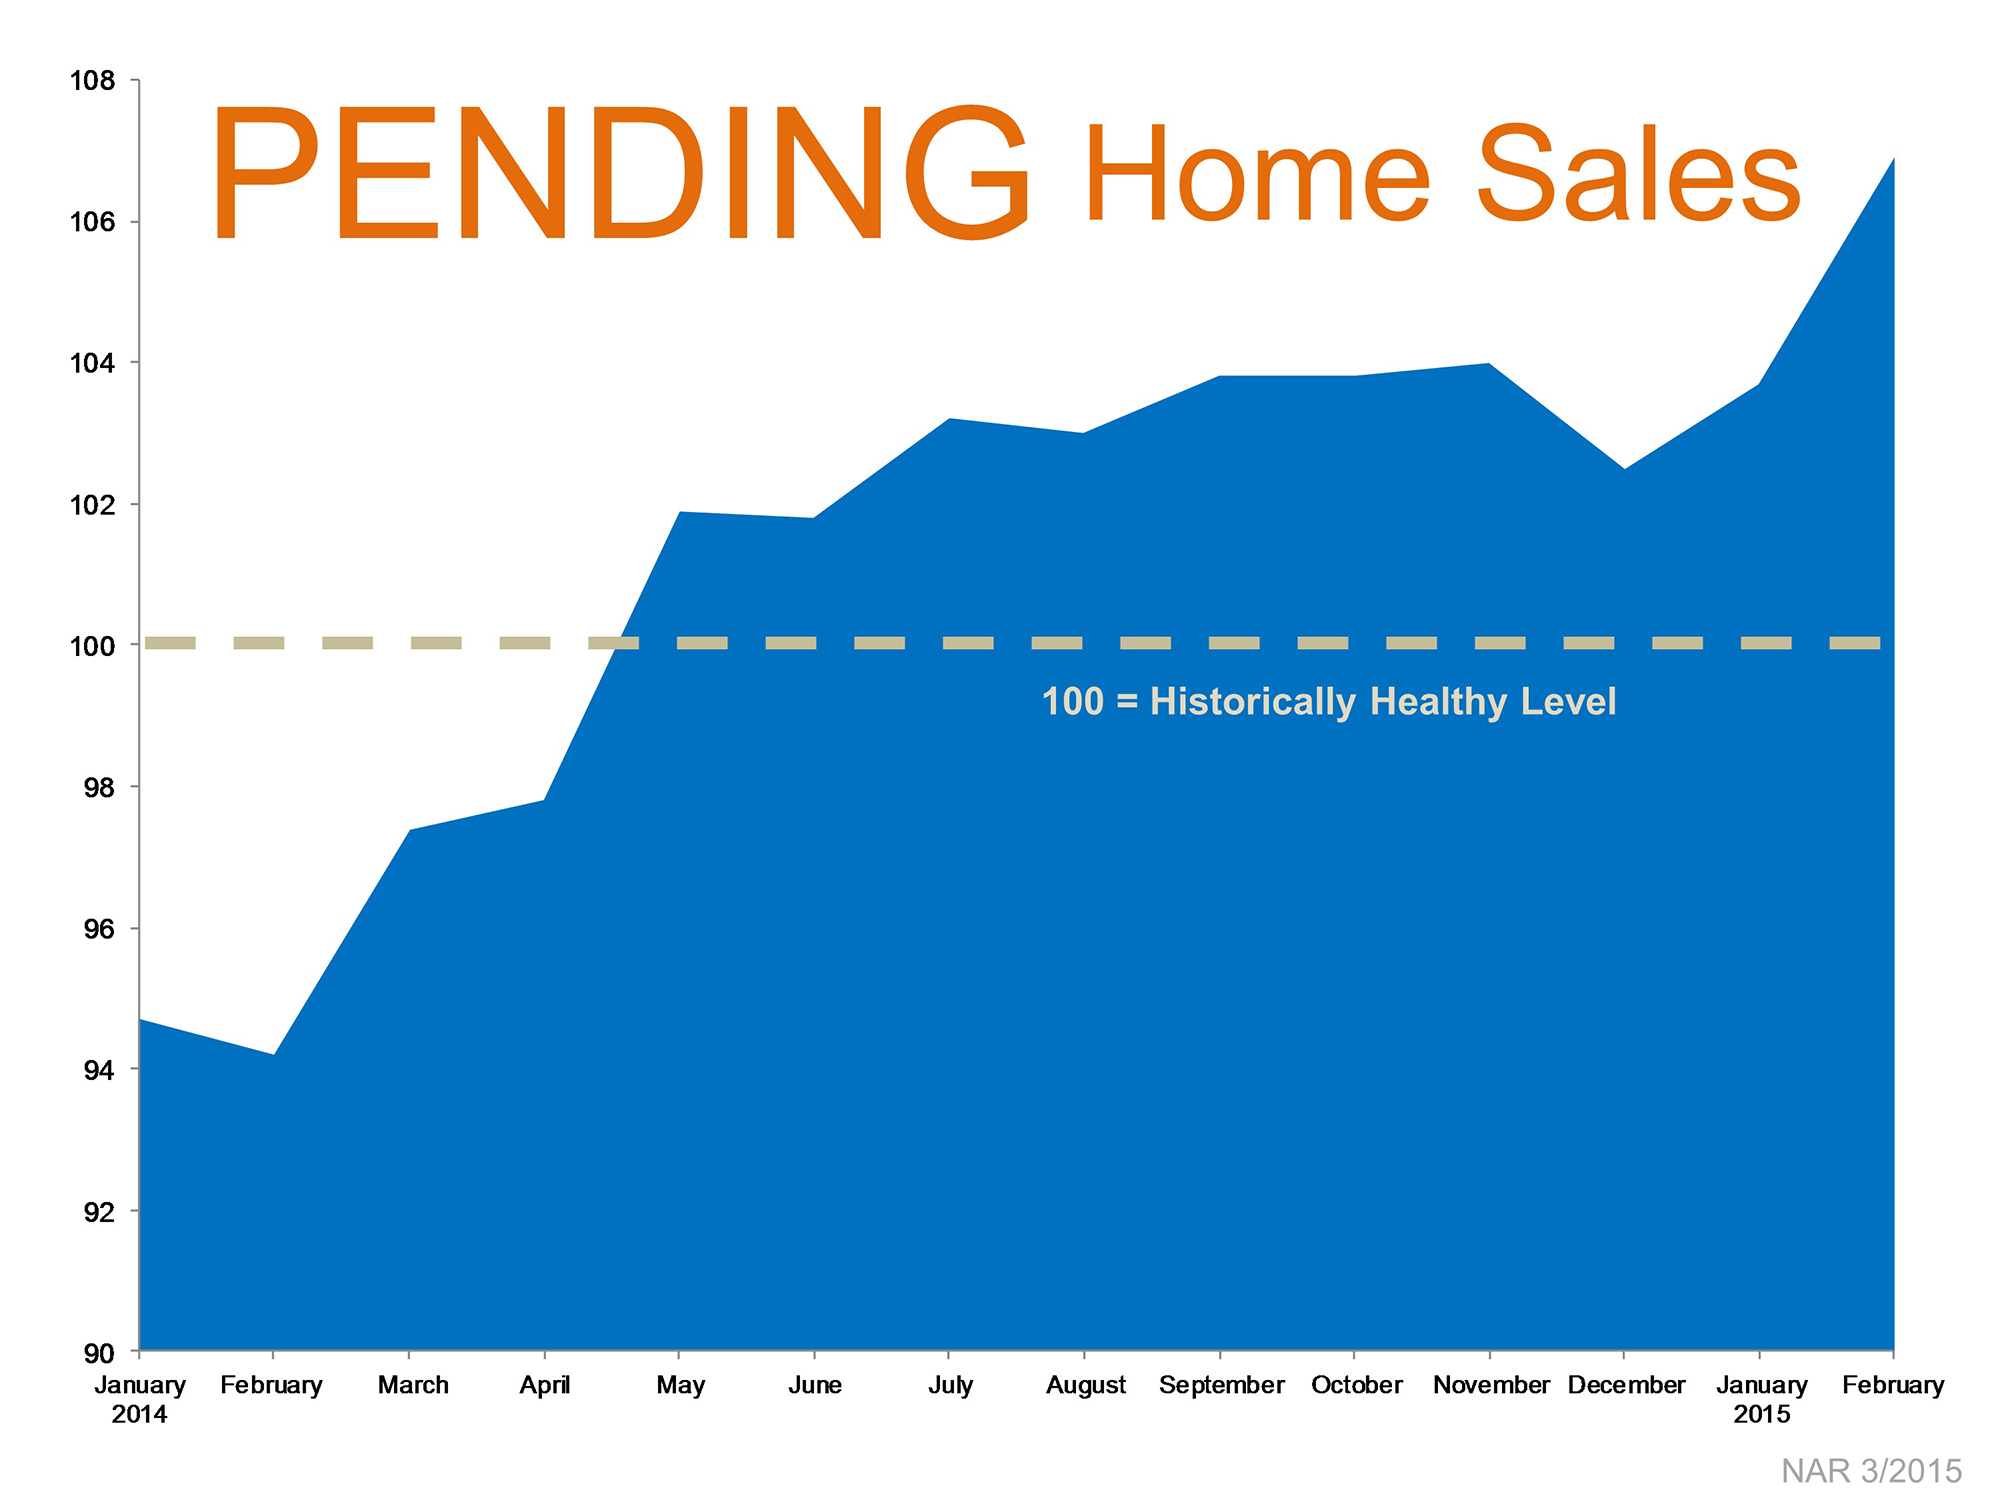
National Pending Sales numbers for March haven’t been released yet, but based on what I have seen in Charleston, I expect them to be higher.
Here is Charleston, most markets saw an increase in Pending Sales from March last year to this March.
The biggest jump came from Goose Creek. Last March, there were 53 Pending Sales. This March there are 108, a jump of 103.8%:
Pretty much all areas have seen an increase in Pending Sales. The one exception is James Island, which went from 14 Pending Sales last March to 10 Pending Sales this March, a drop of 28.6%.
So, home sales are up nationally, and here in Charleston SC. Buyer activity and demand is strong, fueling a hot start to 2015.
Of course, the next question most will ask is how are home values doing?
You can go back to my previous posts as I broke down all the market numbers for the respective areas, but to save you some effort I will just summarize the home values for each area.
This is a comparison of year-over-year numbers for March 2014 and March 2015.
Homes for sale in Hanahan increased their Average Sales Price by 5.7%.
Homes for sale in Goose Creek increased their Average Sales Price by 7.3%.
Homes for sale in Summerville increased their Average Sales Price by 7.2%.
Homes for sale in Mt Pleasant increased their Average Sales Price by 6.7%.
Homes for sale in Moncks Corner increased their Average Sales Price by 7%.
Homes for sale in James Island increased their Average Sales Price by 1.2%.
Homes for sale in Johns Island increased their Average Sales Price by 10.8%.
Homes for sale in Isle Of Palms increased their Average Sales Price by 1.8%.
Homes for sale in North Charleston increased their Average Sales Price by 1.5%.
Homes for sale in Sullivans Island decreased their Average Sales Price by 19.2%.
Homes for sale in Charleston SC increased their Average Sales Price by 7.8%.
Here are the numbers for the entire Charleston MLS:
What This Means For Buyers
It looks like the word is already out to potential buyers. However, if you are thinking about buying homes for sale in Charleston SC, then one thing to keep in mind–homes aren’t getting any cheaper.
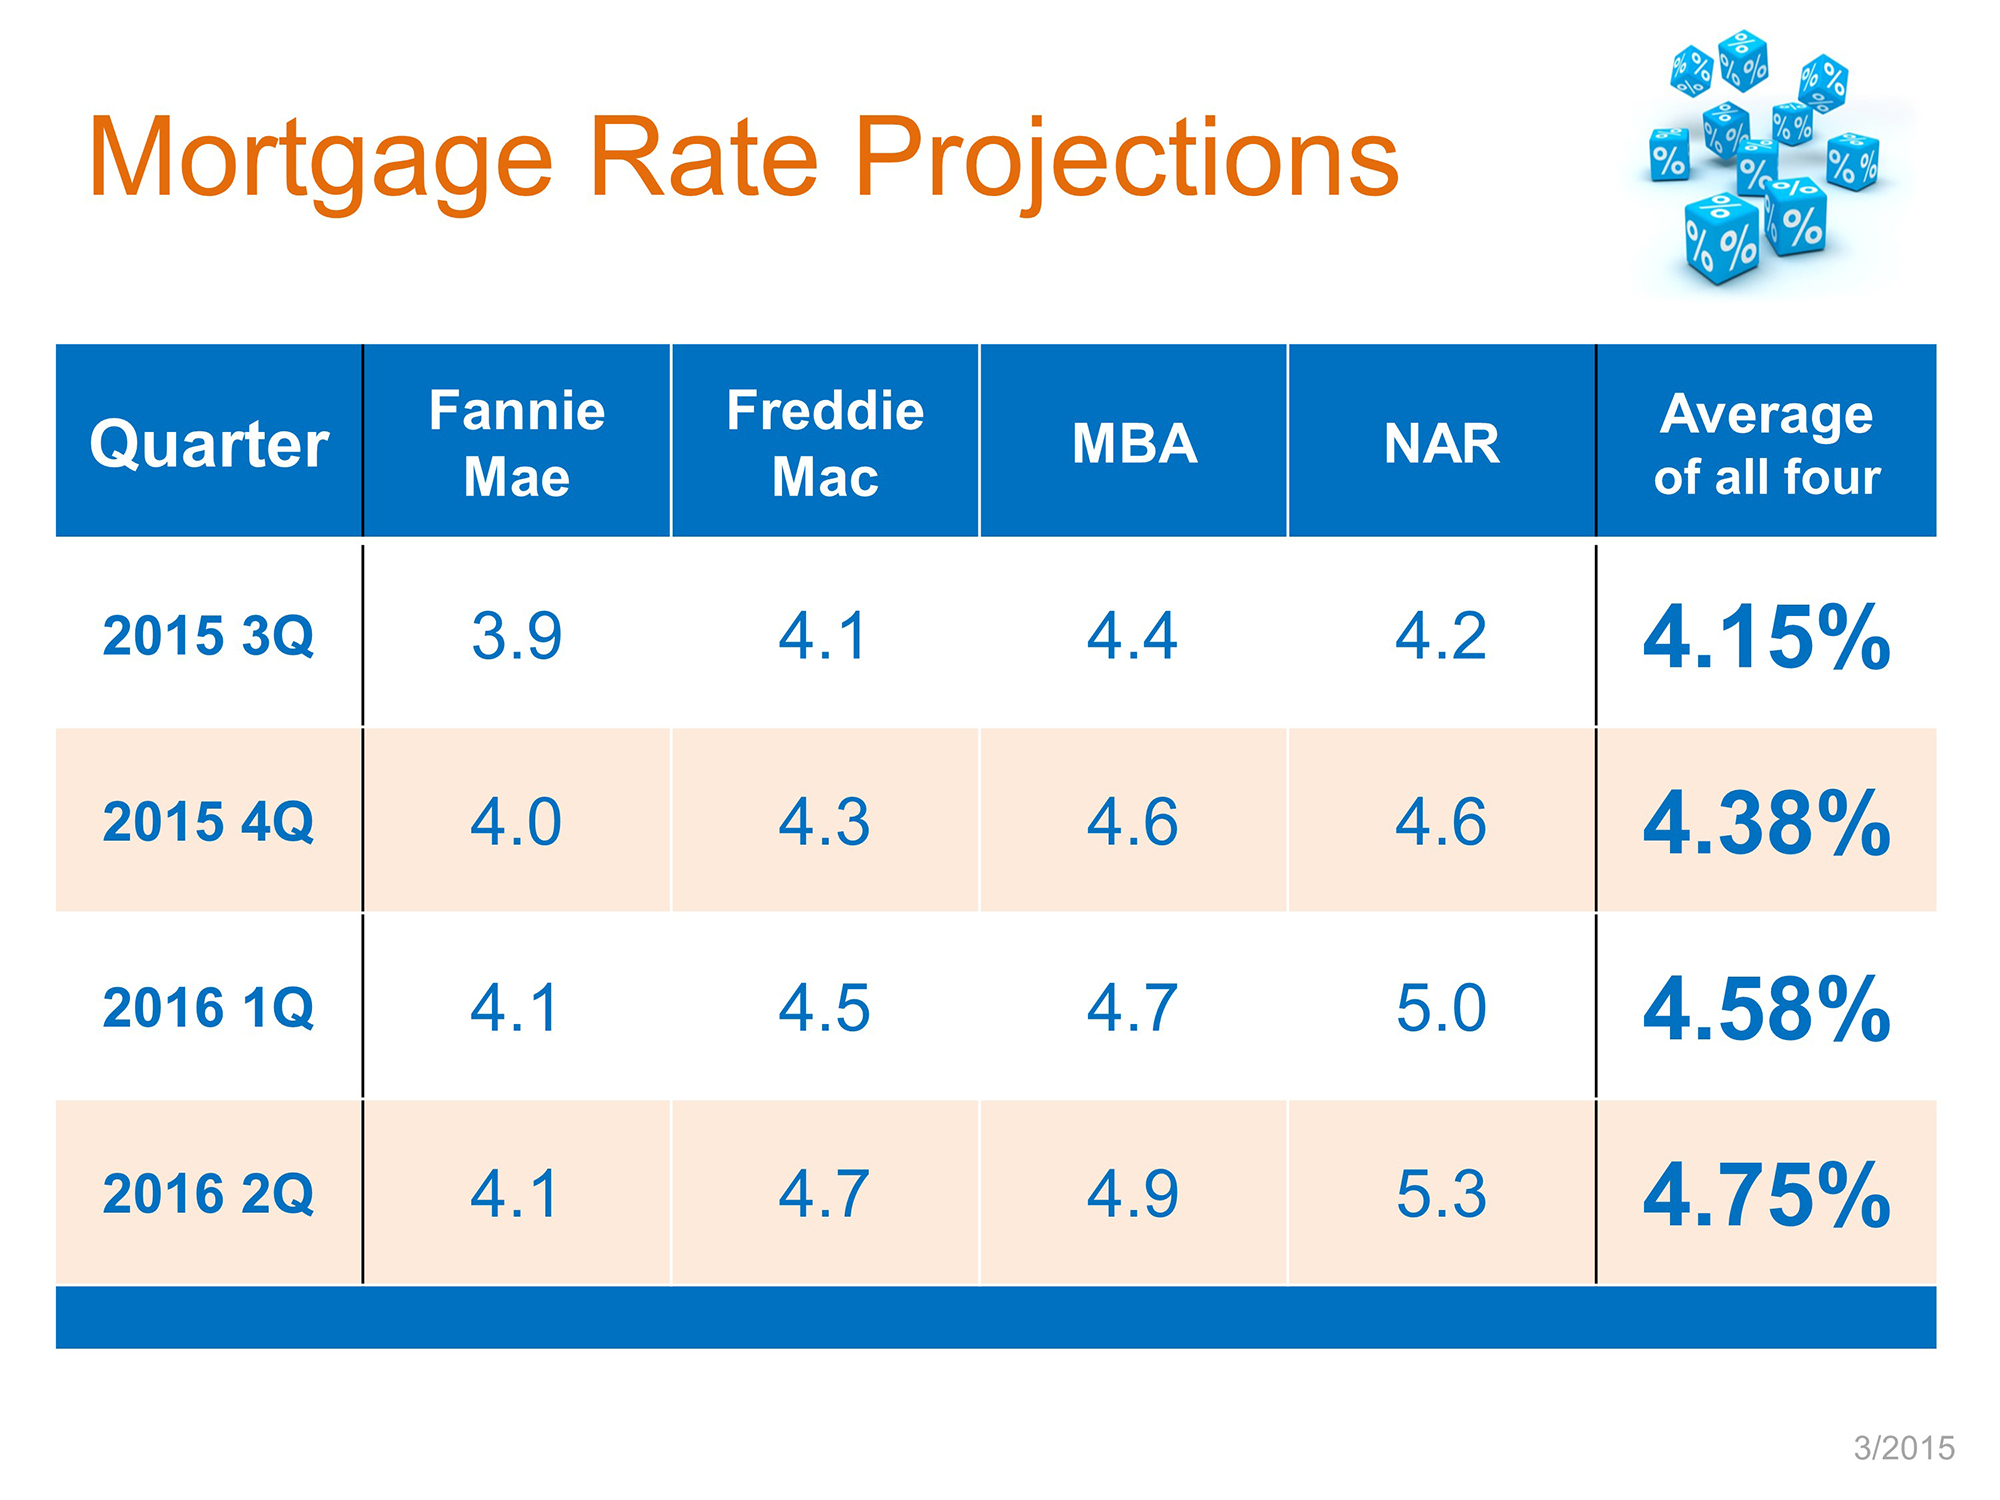 Not only are home prices going up, but interest rates are expected to go up as well.
Industry analysts such as The National Association of Realtors, The Mortgage Bankers Of America, Freddie Mac, and Fannie Mae predict interest rates to go up by as much as 1% before year’s end.
This, combined with increases in home prices means buyers that wait could end up paying more for less house.
What This Means For Sellers
Sellers in the Charleston SC area need to realize that one big hindrance to the real estate market, both nationally and locally, is the lack of inventory.
Simply put, we need more homes for sale in Charleston SC.
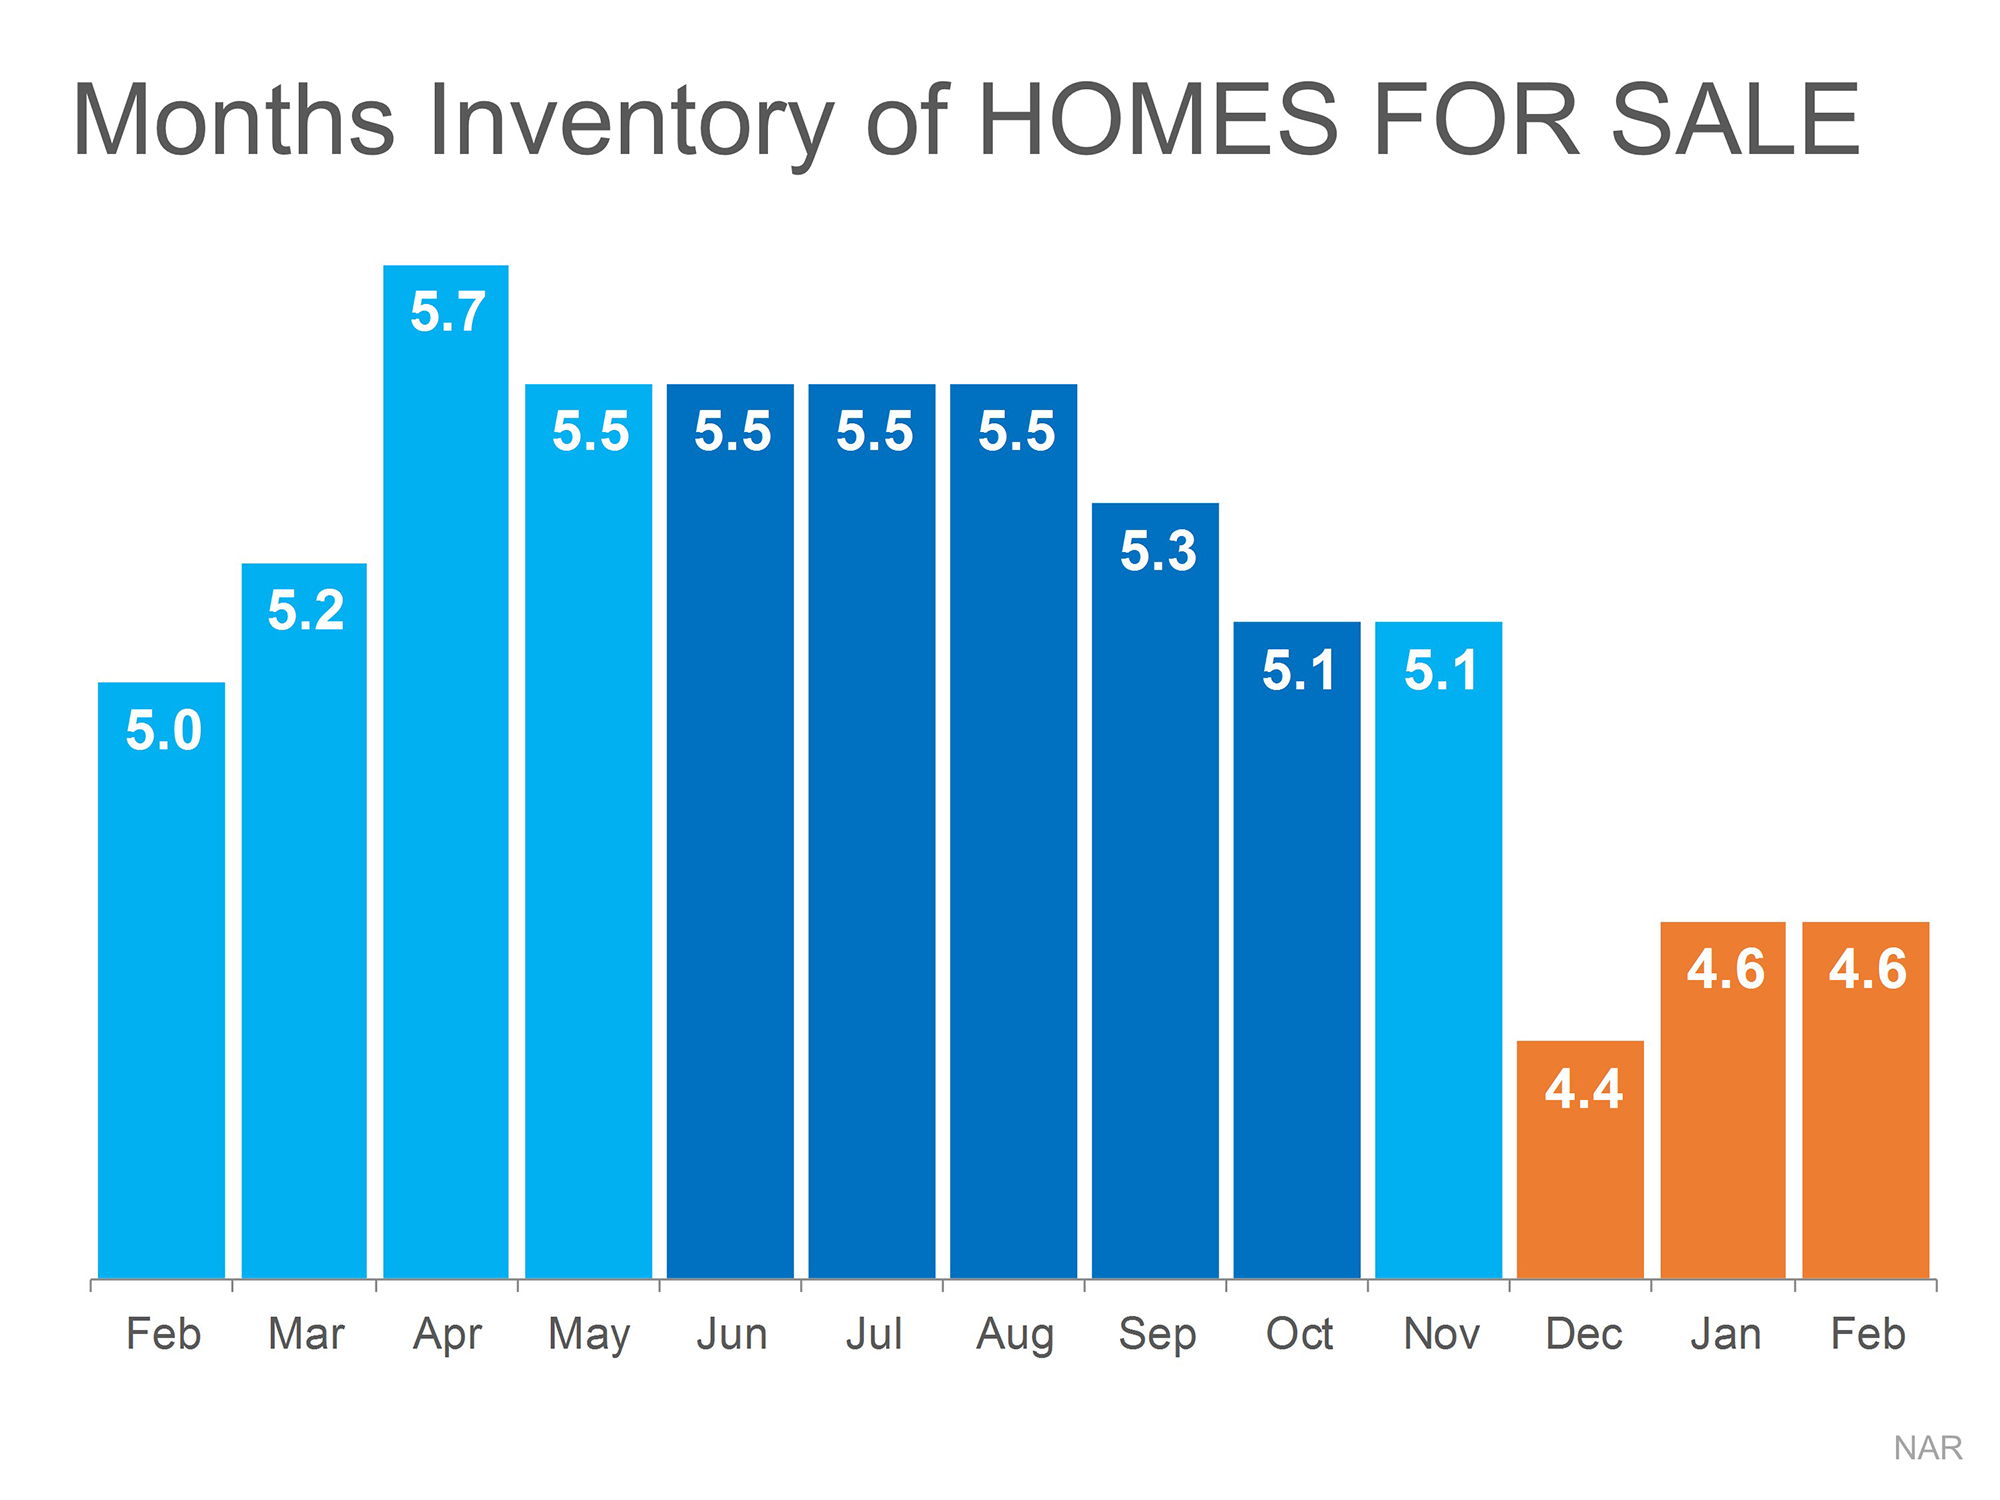 National and local inventory levels have dropped.
In fact, national inventory levels are down for each month of 2015 so far.
This is part of the reason why home values have increased–demand exceeds supply.
However, this can lead to a detrimental affect for both buyers and sellers.
Buyers could get priced out of the market. While increasing home values is a good thing if you have a home to sell, it could backfire on sellers.
The potential pool of buyers could shrink as buyers get priced out of the market. Sellers could also see themselves get priced out of their next home.
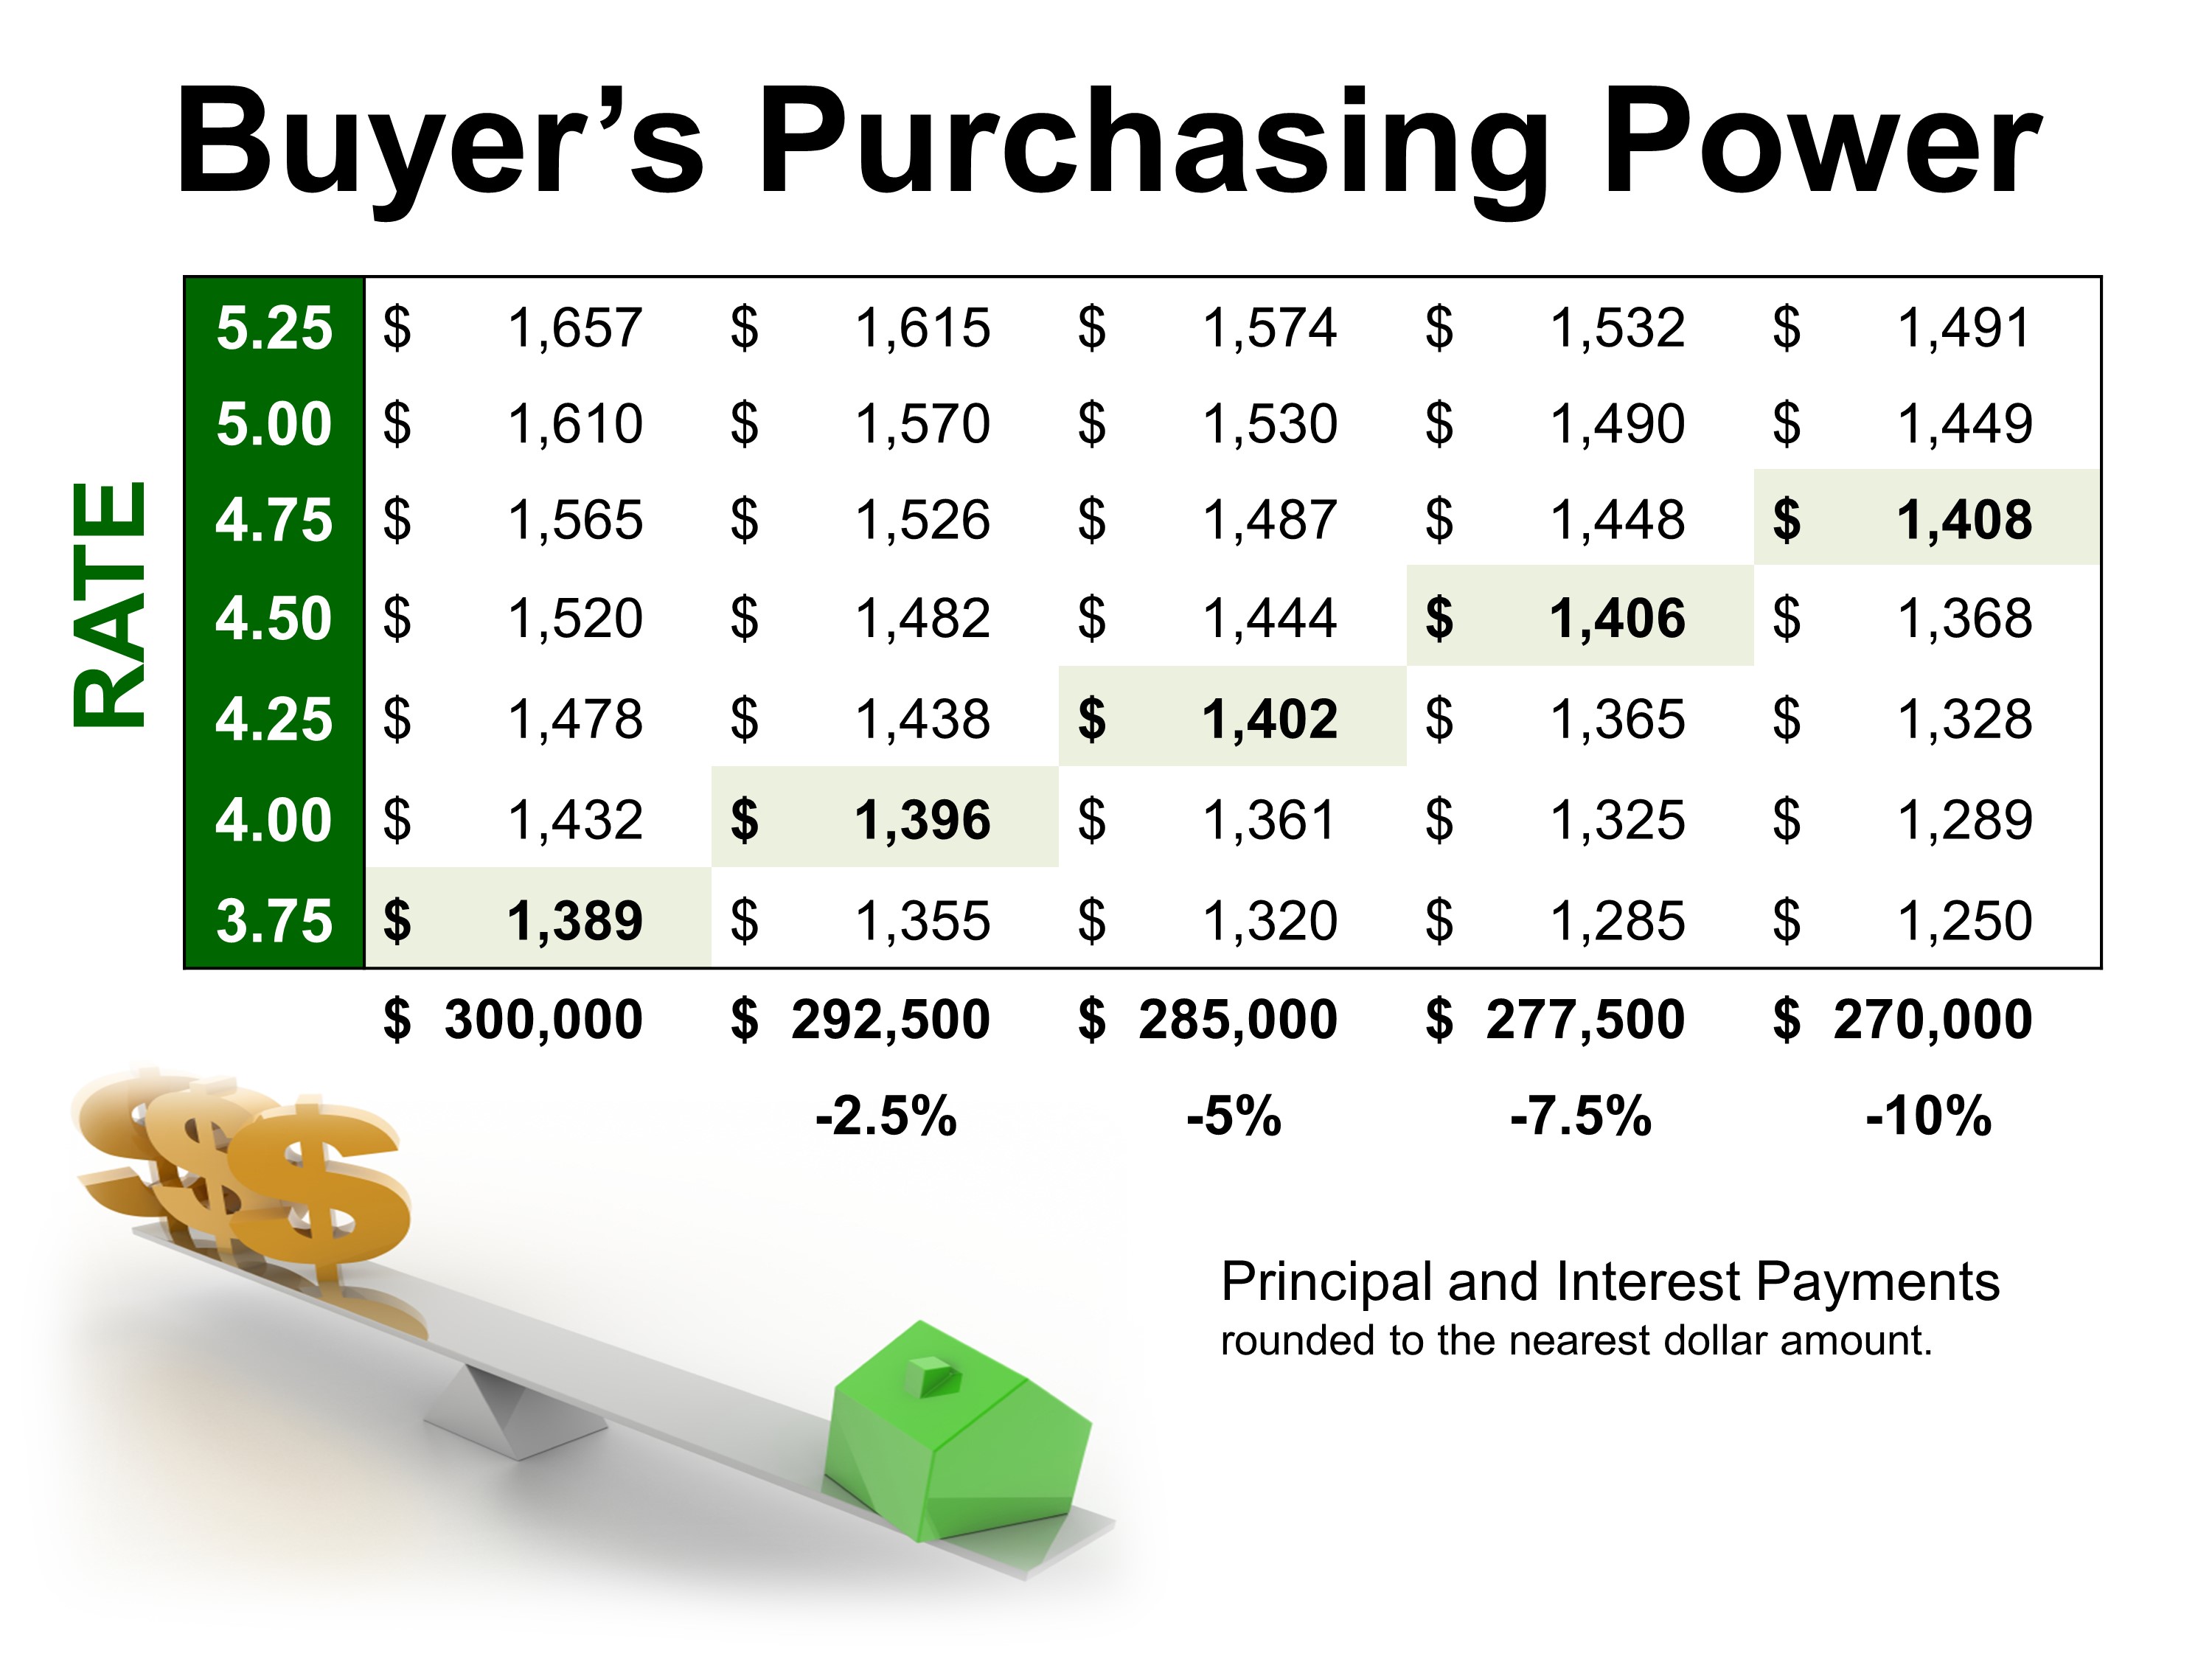
This infographic demonstrates how rising interest rates affects a buyer’s purchasing power.
In this example, say a buyer wants to keep their monthly mortgage payment around $1400/month.
As interest rates rise, the amount of home this buyer can afford decreases in order to keep the monthly payment around $1400/month.
Combine this with increasing home prices and you can see how quickly a buyer’s purchasing power can drop.
Here is a look at the Months Supply of Inventory for the entire Charleston MLS:
Just like the national numbers, the Months Supply of homes for sale in Charleston SC keeps dropping.
2015 is primed to be a great year for Charleston SC real estate. However, low inventory could have a detrimental affect.
Right now is a good time to buy or sell homes for sale in Charleston SC. Whether or not that remains the case for the remainder of 2015 is yet to be determined.
If you are thinking about buying homes for sale in Charleston SC, then visit my Pam Marshall Realtor website.
You can search the Charleston MLS, download Buyers Guides, check out some helpful home buying videos, and have a free list of homes sent to your inbox.
If you are thinking about selling in the Charleston SC area, then check out my Pam Marshall Realtor sellers page and learn more about my internet focused marketing to get your home sold.
If you want to keep up with the latest MLS stats for homes for sale in Charleston SC, then check out my Charleston SC Real Estate stats page.
Leave a Reply