


Homes For Sale In Ion: Market Overview
November is fast approaching, so I figured I would look at market stats for homes for sale in Ion for September. In a couple weeks I will update with October stats, so I thought it would be good to look back and get an idea of where the market stood for Ion.
The graphs I am using are for the last 12 months, so you will be able to see how the numbers have performed not only year-to-date, but also for the last year overall. This will let you know where the numbers stand right now, how they compared a year ago, as well as 2014 year-to-date.
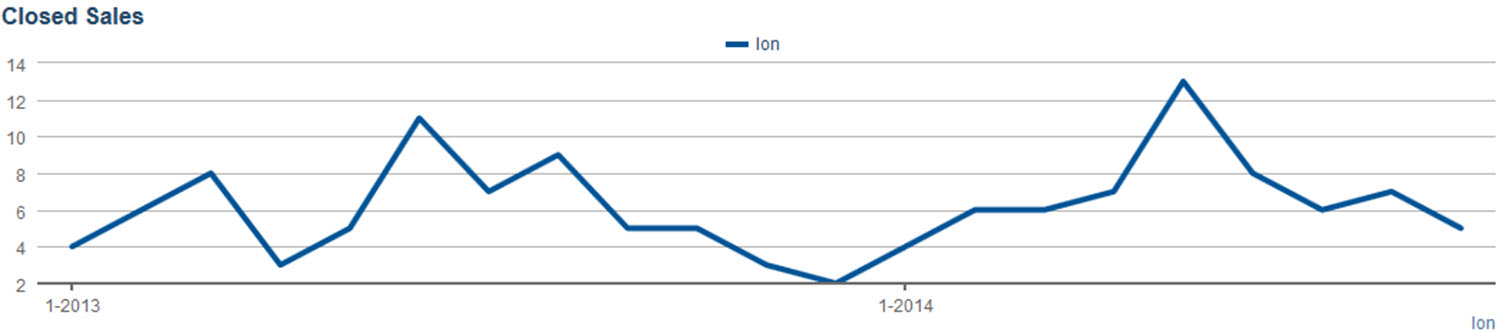 First, let’s look at total closed sales. For September, there were 5 closed sales, down from 7 in August.
So far, sales peaked in Ion for 2014 in May, with 13 closed sales. This tops the peak month for 2013, which was June, that had 11 closed sales.
I also look at pending sales as these can be an indicator of future sales (usually 30-60 days until they are closed sales). For September, there were 3 homes for sale in Ion that went under contract, compared to 6 in August.
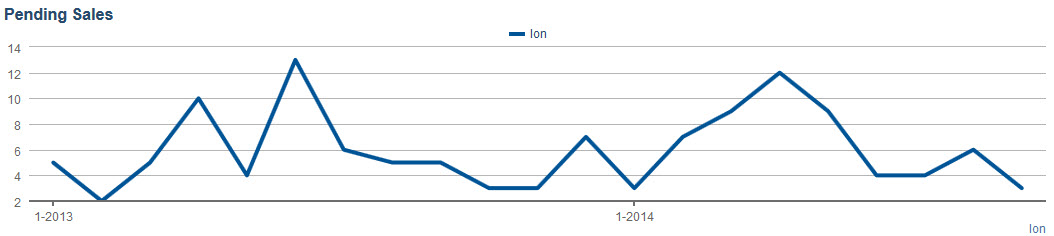
The peak so far in 2014 was April, which saw 12 homes go under contract. Last year, the peak month for Ion homes going under contract was June, with 13 homes.
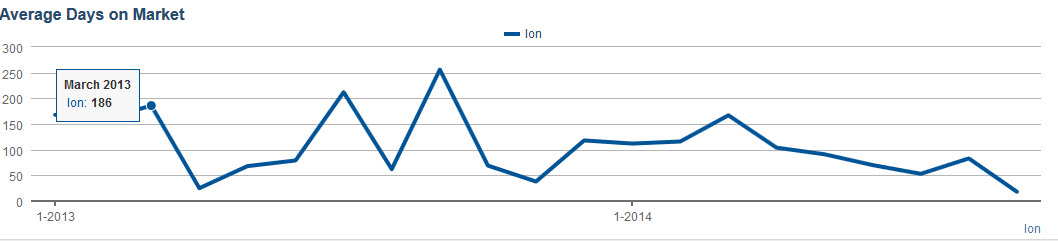
As far as average Days On the Market (DOM), homes for sale in Ion averaged 18 DOM for September.
Homes For Sale In Ion: How Are Home Values?
For August, that number was 83. If you look at the DOM graph, you can see that number has been dropping for the better part of this year, and is below the lowest point of last year.
One final stat I like to look at is the average Price Per Square Foot, which is a good
 baseline number to use to compare homes that differ in size, style, number of bedrooms and baths, etc.
The average Price Per Square Foot in Ion for September was $345, up from the August average of $277.
Homes For Sale In Ion: Just How Is The Market?
So, what does all this mean for homes for sale in Ion? While the number of closed sales and pending sales have declined, the DOM and average price per square foot have increased. In fact, both the median and average sales price have increased.
If you look at the first graph showing closed sales, you can see that there was a dip in 2013, and 2014 is following that same pattern. So, we are on the same trajectory, but at higher numbers.
One thing that is also to note is the months supply of inventory. 6 months indicates a normal market, anything less is a sellers market. May was the lowest number at 3.4 months. August was 4.8 months and September was 5.5 months.
This would indicate that supply is catching up with demand. So, we should see a continued rise in home values, albeit a little slower. It will definitely be interesting to see the October numbers to see where the market is heading in Ion–is this the typical end-of-the-year slowdown common to Charleston in general (and Ion specifically), is the market slowing down overall, or will we see the numbers increase?
Last year the closed sales dropped at year’s end. But, there was a spike in January. The year before (December 2012) saw 9 closings–but a big dip in January. With the pending sales numbers dropping, it looks like there won’t be a lot of closings the next couple months–but that is why I will look at the numbers again to allow people to draw their own conclusions.
If you are thinking of buying or selling homes for sale in Ion, then bee sure to check out my website!
Leave a Reply