

Here’s the latest stats for James Island real estate straight from the James Island MLS.
James Island Real Estate: Buying Side
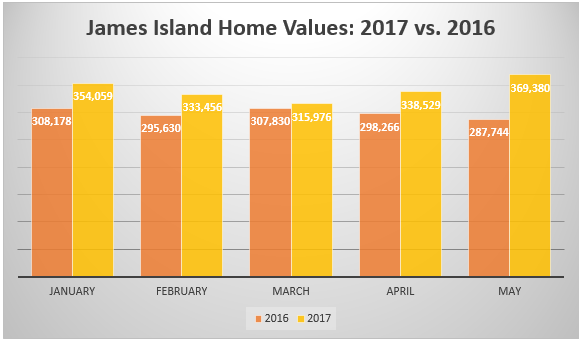
First up is a look at the Average Sales Price:
2017 kicked off with an Average Sales Price of $354,059.
This dropped in February to $333,456. In March it dropped again to $315,976. In April values shot up to $338,529, and again in May to $369,380.
However, they are still above their 2016 numbers.
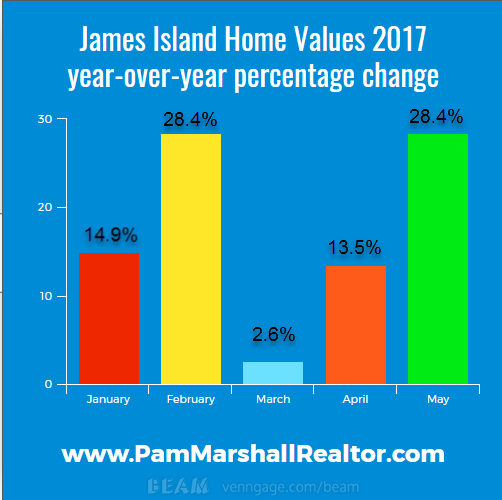
Here is a comparison of home values in 2017 to 2016:
Compared to 2016, home values have skyrocketed when looking at the year-over-year comparison.
Here is the year-over-year changes in prices so far in 2017:
Pending Sales
Next up is a look at James Island homes for sale that went under contract:
Here is a comparison of 2017 vs. 2016:
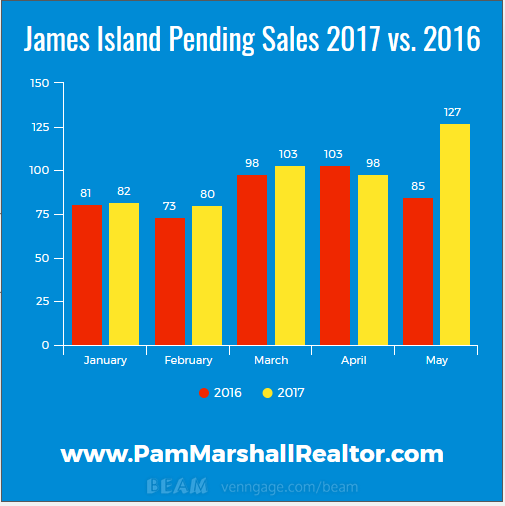
May was the most Pending Sales for James Island real estate since March of 2006 which saw 213 Pending Sales. The most ever happened in February of 2005 with 360 Pending Sales.
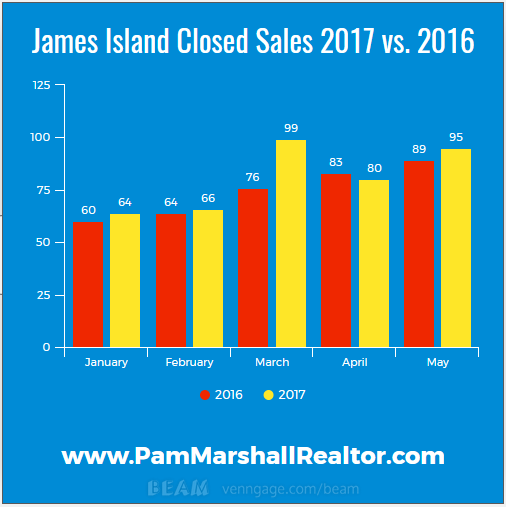
Closed Sales
January saw 64 James Island homes for sale close. In February, there were 66 more. March jumped up to 99 Closed Sales. April dropped to 80, and May saw 95 Closed Sales.
Here is the comparison between 2017 and 2016:
James Island Real Estate Stats: Selling Side
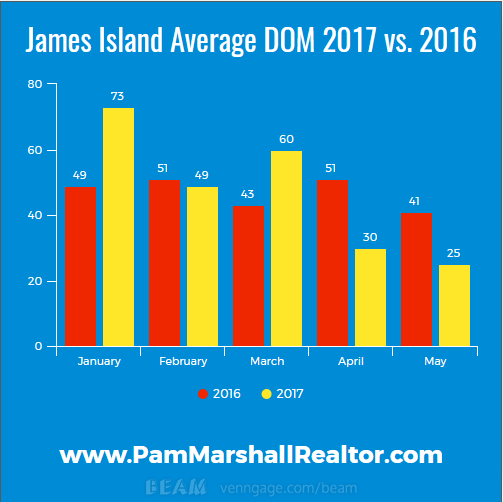
Average Days On The Market
Here is the stats for the Average Days On the Market (DOM) for James Island homes for sale:
Here is the comparison between this year and last:
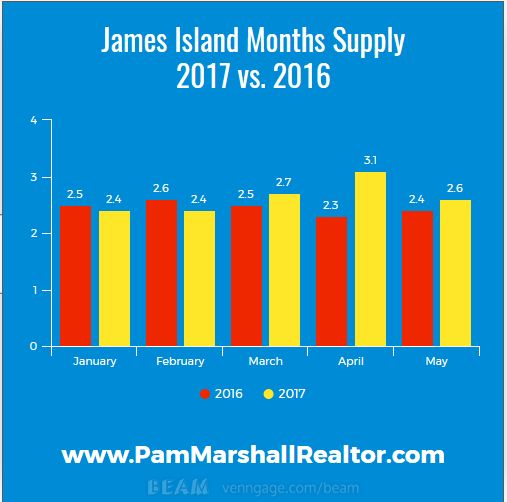
Months Supply
Next up is the Months Supply of James Island homes for sale:
That has pretty much been in the mid 2 month range so far this year, with the exception of April, when it past 3 Months Supply. Very similar to the same time last year:
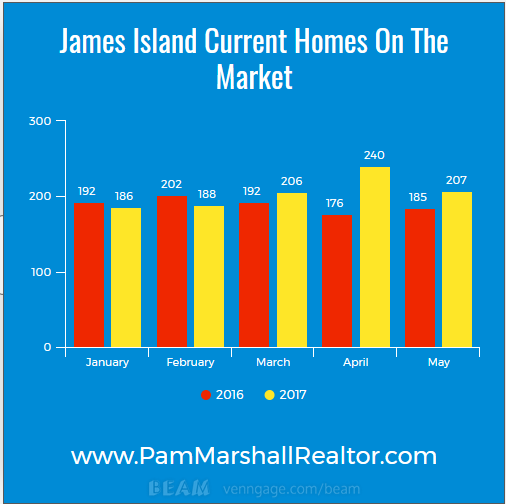
Current James Island Real Estate Stats
Here is a look at the current James Island homes for sale on the James Island MLS:
2017 kicked off with 186 James Island homes for sale, and that number was trending upwards–188 in February, 206 in March, and 240 in April. But, May took a dip down to 207 active listings.
The 240 homes listed in April were the most since July of 2015, which saw 249 active listings for James Island. The most ever? April and September of 2007 with 627 each.
Here is a comparison of 2017 and 2016:
New Listings
Finally, a look at new James Island homes to enter the market:
Listings shot up in 2017, although they dropped in May. January saw 100 new listings on the James Island MLS, February added 101 more, then March saw 136 new James Island homes for sale. In May they dropped to 116.
It’s worth noting that April was the most New Listings since March 2010, which saw 151 New Listings. January 2005 is still the highest point, with 449 New Listings added.
What Does This Mean?
Pretty much what is happening in real estate markets across the country holds true for the James Island real estate market. Demand is strong, and inventory is low.
Home values are up substantially by their year-over-year numbers so far in 2017, although March saw a smaller increase at 2.6%. Otherwise, those numbers have increased in the double digits.
Pending Sales and Closed Sales have both soared so far in 2017, despite a limited inventory.
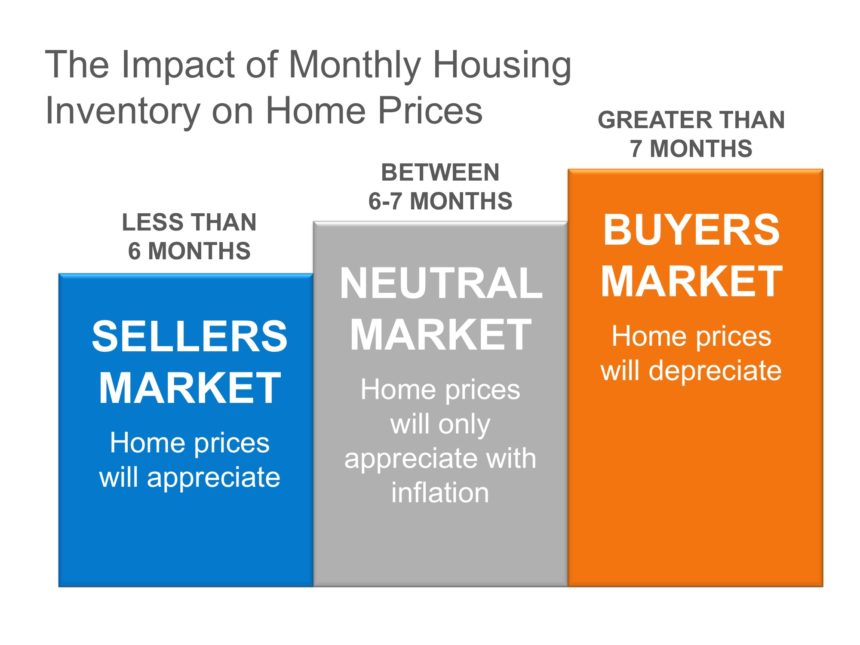
Average Days On The Market have plummeted, and Months Supply remains low. Keep in mind that 6 Months Inventory indicates a neutral, normal market, and James Island is definitely in the seller’s market range:
The number of James Island homes for sale has been on the increase in 2017, fueled by the increase of New Listings to hit the market. This is a promising sign.
Of course, those numbers declined in May, but April saw the most Active Listings in 2 years, and also saw the most New Listings added in 5 years.
Plus, Summer is typically the busy season for New Listings, so there is a good chance that we see those numbers increase, which would be a good thing to help meet the strong demand that exists.
The market remains a challenge for buyers. Selection is limited, which leads to homes not staying on the market for long. It can also lead to bidding wars.
For sellers, it is a seller’s market, so things are good.
Is A Housing Bubble Forming On James Island?
Simple answer? No. For a more in depth explanation of why we are not in a housing bubble, read this post.
As far as James Island real estate, May saw the Average Sales Price hit $369,380. The highest point of 2016 was in October, which had an Average Sales Price of $391,121.
That was the highest since January of 2015, at $435,166. That is the highest Average Sales Price for James Island real estate ever, so far.
The highest Average Sales Price during the real estate boom in the early 2000’s was in January of 2007, at $401,734.
So, basically, James Island has surpassed it’s previous peak high during the real estate boom, and that was over 2 years ago.
The Average Sales Price has trended down since then, but it is on the upswing again in 2017, and could match or exceed that 2015 high point.
But that does not mean we are in a housing bubble? No. This is simple economics–there is strong demand and not enough supply. This will continue to drive prices upward.
But, with more James Island homes for sale coming onto the James Island real estate market, the gap between demand and supply will shrink. But, that is ok. Home values will continue to increase, but then it would happen at a less rapid pace.
Keep in mind, we still need Months Supply to add another 3.5 months to get to a 6 Month Supply to get back to a normal real estate market. Were that to happen, the market would still be fine and we would still see appreciation.
To keep up with the latest real estate news, trends, and stats, follow my blogs here and here.
If you are looking into buying or selling James Island real estate, then check out my Pam Marshall Realtor website.
Leave a Reply