

The 2017 Johns Island Real Estate Market: Buying Stats
Average Sales Price
Here’s a look at the Johns Island real estate market so far in 2017. First, a look at the Average Sales Price:
January saw the Average Sales Price for Johns Island homes for sale at $340,049. It’s been up and down in 2017, and in February the Average Sales Price dropped to $322,406.
It increased in March to $327,715 and then shot up to $360,702 in April. In May, it dropped again to $330,932.
Here is a comparison of the 2017 numbers to 2016:
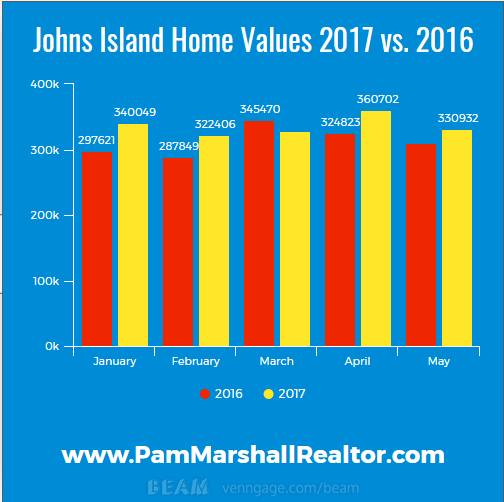
The peak month for 2016 came in October, with the Average Sales Price of $349,317. That has already been exceeded in 2017, in April.
The highest Average Sales Price for Johns Island homes was in January of 2006, when the average hit $464,891.
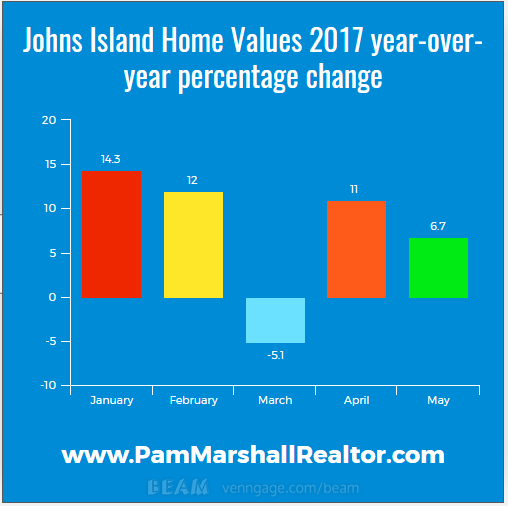
Here is a look at the year-over-year percent change for the Average Sales Price so far in 2017:
Closed Sales
Next up is a look at Closed Sales:
January kicked off 2017 with 38 homes sold. In February that dropped to 30. In March, it shot up to 53, then dropped to 45 in April. May shot up to 71 Closed Sales.
Here is a comparison of 2017 and 2016 for Closed Sales:
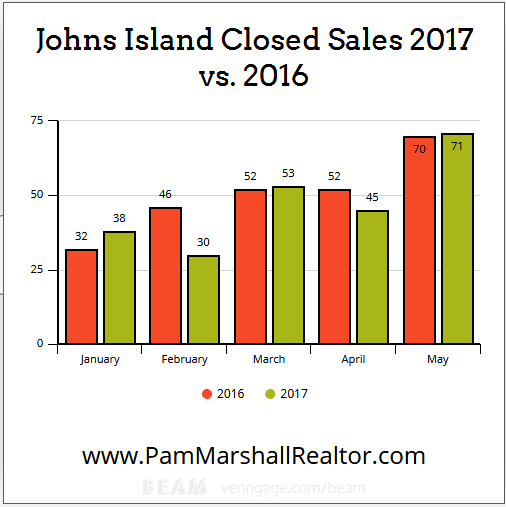
The peak month last year happened in June, which saw 74 Johns Island homes for sale closed. That is also the highest month for Closed Sales on Johns Island.
Pending Sales
Next up is a look at Pending Sales:
January kicked off with 68 Pending Sales. February saw that drop to 52 homes. In March it was up to 76, and April Pending Sales declined to 68. May shot up to 96 Johns Island homes under contract.
The trend so far in 2017 is similar to 2016:
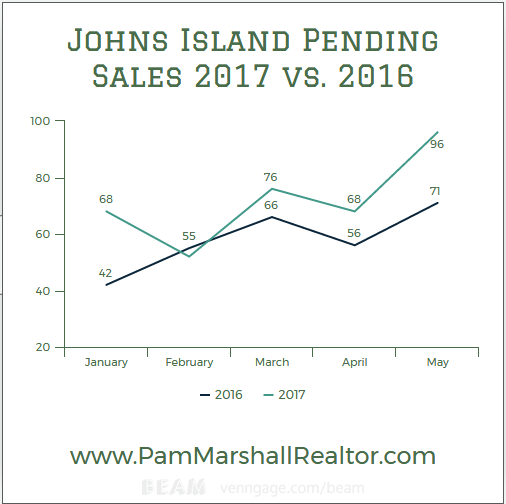
The peak month for 2016 was May, with 71 Pending Sales. That was the most since April of 2015, which saw 73 Pending Sales. May of this year was easily the most Pending Sales recorded for Johns Island.
Johns Island Real Estate: Selling Stats
Average Days On The Market
Here is a look at the Average Days On The Market (DOM) for Johns Island real estate:
In January, the Average DOM for Johns Island was 72 days. That increased in February to 79 days. In March, it dropped slightly to 76.
April took a big drop to 48 DOM. May increased slightly to 50 DOM.
Here is a comparison of 2017 and 2016:
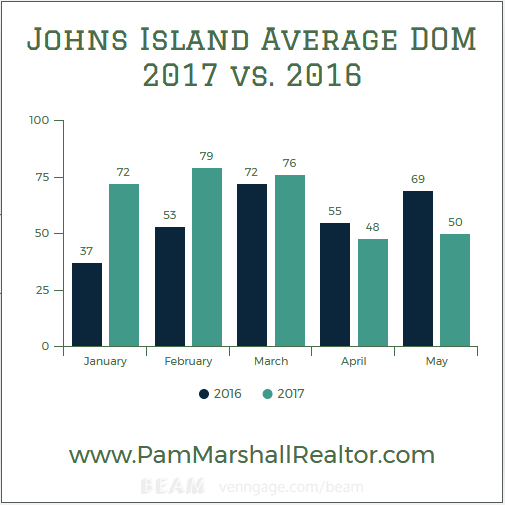
The lowest Average DOM last year was in September at 28 DOM. The lowest ever came exactly ten years prior, with September of 2006 having an Average DOM of 26 days.
Months Supply Of Inventory
Next up is a look at the Months Supply of Johns Island homes for sale:
In January, the Months Supply of Johns Island homes for sale was 4.7 months. It increased slightly in February to 4.8 months.
In March it increased again to 5.1 months, then again in April to 5.3 months. It dropped slightly in May to 5 months.
Here is a look at 2017 and 2016:
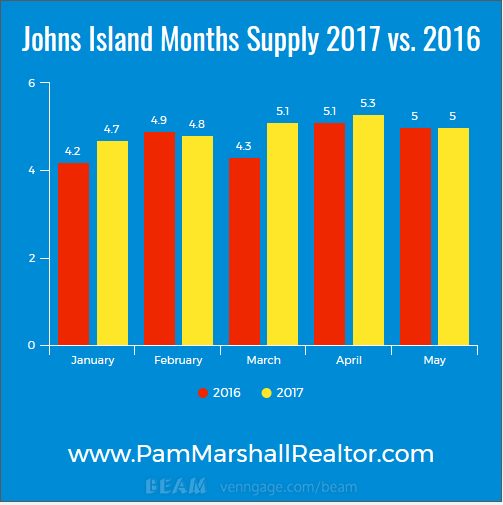
September of last year saw the highest Months Supply of the year at 5.6 months. The lowest was in July, at 4.1 months.
The last time Johns Island saw a Months Supply at or above 6 months was March of 2015 with a 6.4 Months Supply.
Interestingly enough, the lowest recorded Months Supply came in June of 2005 at 4.1 months.
Johns Island Real Estate: Current Numbers
Johns Island Homes For Sale
Here is a look at the current number of Johns Island homes for sale on the Johns Island MLS:
January saw 246 Johns Island homes for sale. In February, that increased to 255. March increased again to 270, and another increase happened in April, to 288.
May saw a slight decline to 283 homes for sale.
The trend for 2017 matches the trend in 2016:
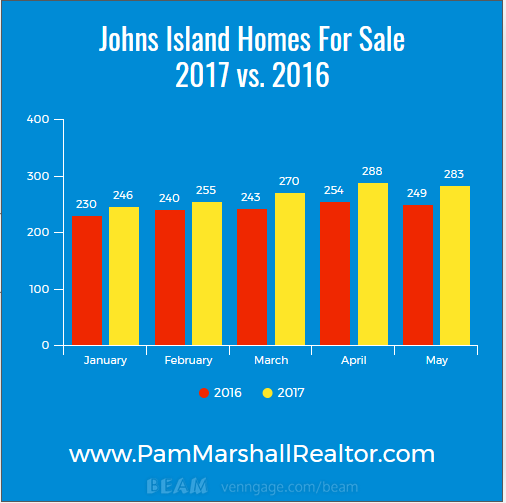
September of 2016 was the peak month last year for Johns Island homes for sale, with 272 homes listed.
That was the most since September of 2011, which had 286 homes for sale. The most ever happened in September of 2007 with 385 homes for sale.
New Listings
Finally, a look at New Listings to hit the Johns Island real estate market in 2017:
January saw 97 New Listings hit the James Island real estate market. That decreased to 73 in February. It shot up to 119 New Listings in March, then dropped to 106 in April.
May saw 124 New Listings added to the Johns Island real estate market.
Here is a comparison of 2017 and 2016:
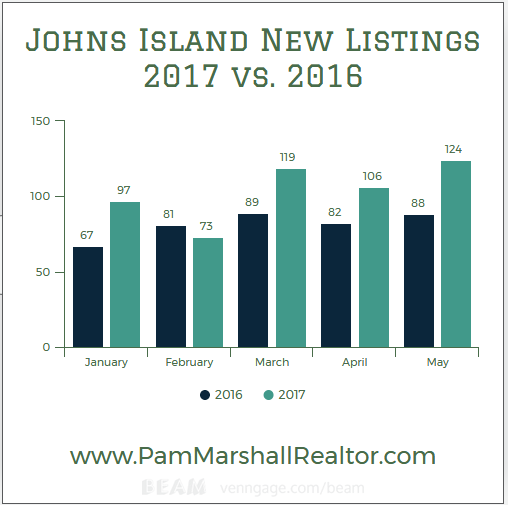
The highest amount of New Listings in 2016 came in March, with 89 new Johns Island homes for sale.
2017 has seen 100 or more New Listings (in a month) for the first time ever on Johns Island, and it has happened for three consecutive months. The previous high was in January of this year with 97 New Listings.
January was the first month with 90 or more New Listings since February of 2015 with 91. The previous peak for the most New Listings in a month on Johns Island happened in September 2006 and March 2007, with each month adding 95 New Listings.
What It Means
By the looks of things, the Johns Island real estate market is doing fine. It actually is performing better than the national trends and averages.
Nationwide buyer demand remains strong, but inventory is lacking. This is causing home values to skyrocket.
Values are doing well on Johns Island, although they have fluctuated. However, they are (mostly) above 2016.
The reason for this is not a lack of demand. The strong upward trend of Closed Sales and Pending Sales show that demand remains strong.
The one thing that is different about the Johns Island real estate market is the fact that supply is mostly keeping up with that demand–much better than most markets.
A “normal” real estate market will have a 6 Months Supply of inventory. Although Johns Island does not have that, it is a lot closer than the national average with a Months Supply averaging 4.98 months so far in 2017.
Impact Of New Construction and New Inventory
Nationwide, home builders are scrambling to catch up to the market and narrow the wide gap between supply and demand. On Johns Island, they are succeeding:
January saw 53 New Construction New Listings. March saw 60 more, and May there were 65. January alone matched the previous highs, set in June 2006 and June 2007, which also saw 53 New Homes listed.
April of this year saw the most homes for sale on Johns Island since the highest point of September 2007. These two stats indicate Johns Island is doing very well to keep up with the demand.
Home values are still increasing, but they aren’t blazing a straight upward trend like most of the country.
The New Construction and Homes For Sale stats must also be taken in perspective.
Prior to the real estate crash 10 years ago, builders wound up overbuilding. The market was saturated with listings (of new homes and existing homes), and this was one factor in the market crash.
But today, this market is different. Currently, the Johns Island real estate market is a sellers market by virtue of there being a 5 Months Supply of inventory.
However, this is much closer to a normal market of a 6 Months Supply than the national average.
When there were 385 homes for sale on Johns Island back in 2007, there was also a 15.8 Months Supply of inventory–a very saturated market.
That is not the case with the current Johns Island real estate market.
What we are seeing on Johns Island is a healthy market. Values have fluctuated, but for 2017 they are averaging a year-over-year increase of 7.78%, which is slightly higher than the national average, which is hovering around 6%.
You can see it reflected in the following infographic, which compares New Listings and Closed Sales in 2017:
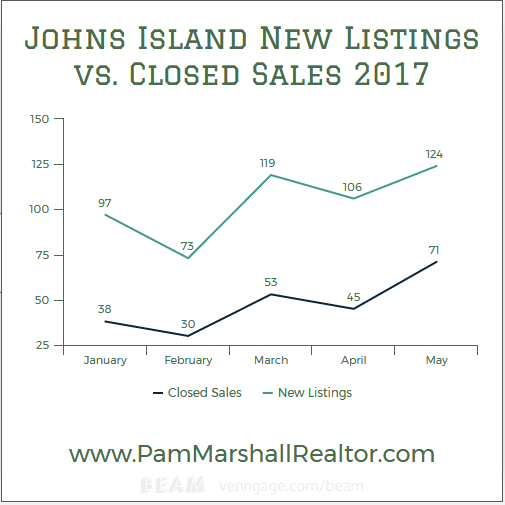
Although Closed Sales outnumber New Listings, keep in mind there is room to wiggle–the Months Supply on Johns Island is at 5 months.
But those numbers are a lot closer than the majority of markets nationwide.
For the latest news, trends, and stats from the real estate market, locally and nationally, be sure to subscribe to this blog or this blog.
You can download free real estate guides here.
If you are thinking about buying or selling Johns Island real estate, be sure to visit my Pam Marshall Realtor website.
Leave a Reply