

2017 MLS Charleston SC Stats
It’s been awhile since I last updated the most recent stats from the Charleston MLS, so let’s take a look at what is happening in the Charleston SC real estate market.
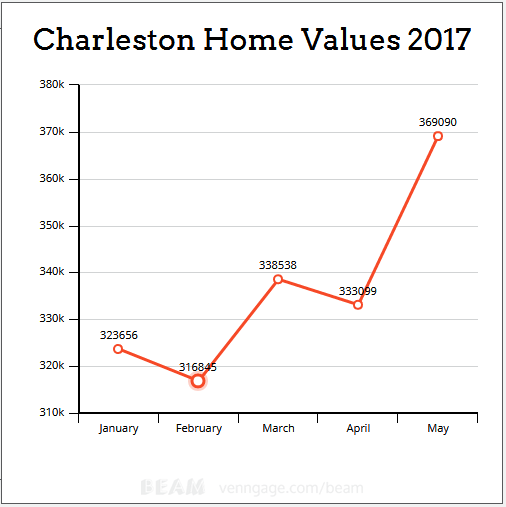
First, a look at home values:
January saw the average home price of $323,656. February saw that number drop to $316,845. In March, it jumped up to $338,538, in April it dipped to $333,099. May saw that number take a big jump, to $369,090.
Here is a look at 2017 so far
Here are the year-over-year comparisons:
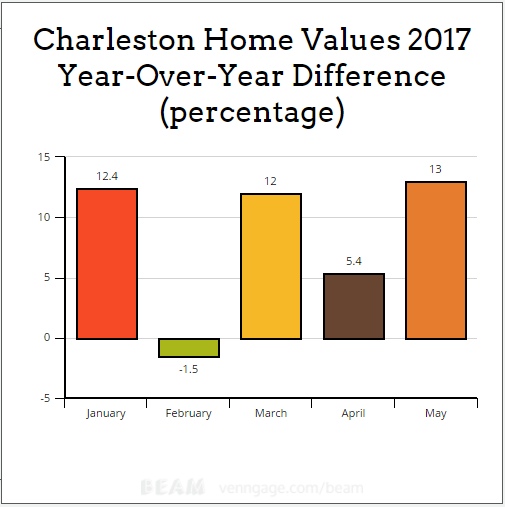
It is interesting to note the big jump in values from April to May–an increase of 10.8% in one month.
Here is a look at Pending Sales:
January saw 1,565 homes go under contract. That increased slightly in February to 1,568. March saw the number of homes under contract jump to 1,871, then drop to 1,771 in April.
May saw 2,061 homes under contract, the highest number in at least 14 years. Will we see Pending Sales increase again in June?
MLS Charleston SC: Sold Homes
Next up is a look at the number of homes sold:
2017 kicked off with 1,033 homes sold. In February that increased to 1,276. March saw 1,665 more homes sold, and that number dropped to 1,526 in April. May rebounded with 1,672 homes sold, the most in 2017.
It’s worth keeping an eye on June as that is typically when we see the highest number of homes sold on the Charleston MLS. Last year in June we saw 1,940 homes sold, the most ever in Charleston.
Here are the latest numbers for Average Days on the Market (DOM):
2017 started off with an average DOM of 65 days. That increased slightly to 69 DOM in February, but has dropped since then to 62 DOM (March), 55 DOM (April), and 54 DOM (May).
Next is a look at the number of homes for sale:
In January we had 5,170 homes on the market. In February that increased to 5,221. It increased again in March to 5,457. In April it dropped to 5,387 and again in May to 5,113.
Inventory is an issue both nationally and locally, something I’ve expanded on before.
MLS Charleston SC: Low Inventory, Seller’s Market
The Charleston SC real estate market simply does not have enough listings to meet the strong buyer demand. This is reflected in the Months Inventory of available homes:
2017 started of with 3.4 months of inventory, which remained the same in February. March saw inventory increase to 3.6 months, then drop to 3.5 months in April, and down to 3.3 months in May.
Keep in mind that Inventory should be at 6 months for a normal real estate market–we are in a seller’s market currently.
Because supply is not keeping up with demand, prices are being driven up.
Summer is typically the busiest time of the year for Charleston SC real estate, so what can we expect this year?
Hopefully, inventory will catch up to demand–at least narrow the gap.
That might be possible based on the number of homes that come onto the market.
Here is a look at new listings so far in 2017:
January saw 1,947 new listings. That increased to 2,042 in February and again in March to 2,572. Then they dropped in April to 2,143, but rebounded in May to 2,304.
March was the most new listings since June of 2007 which saw 2,615 new listings. So perhaps supply is starting to put a little dent in the disparity between supply and demand.
But if we are going to narrow that gap, it needs to happen in the next couple months. Looking back over the years at the Charleston MLS, new listings go way up in Summer months, only to drop after the season:
If you are looking to buy or sell in the Charleston SC real estate market, then make sure you choose the right Charleston SC realtor to work with. Visit my Pam Marshall Realtor website for helpful resources, and you can also check out this blog or this blog.
Leave a Reply