
Moncks Corner Real Estate: Welcome To A Seller’s Market!
Today I am looking at the Charleston MLS to see how the Moncks Corner real estate market did in 2014. First, a look at the Closed Sales:
Although Closed Sales dropped in December, from 56 in November to 47, you can see that overall, Closed Sales increased in 2014 for Moncks Corner. September was the peak month for 2014, with 72 Closed Sales, and April was the lowest month with 30.
Let’s take a look at Closed Sales over the last 3 years:
Those are some big increases–almost a 30% increase in sales in 2013. 2014 was up nearly 20%. This trend is similar to what is happening across Charleston–a big spike in 2013, followed by another increase for 2014, although at a lower rate.
However, Moncks Corner saw huge increases, larger than most areas for both 2013 and 2014.
So, with sales going crazy, how are home values in Moncks Corner? Here is a look at the Average Sales Price for 2014:
Average Sales Price has taken a slide to close out 2014. In November, it was $203,903. In December it dropped to $171,232. 2014 peaked in July with an Average Sales Price of $211,857 and the lowest month was March at $158,171.
Here is a look at 2014 compared to previous years:
Home prices increased over 2013 and 2014 at a steady pace. For a normal real estate market, appreciation usually happens at a 3% to 4% rate. Much of Charleston has seen higher rates of appreciation, and many areas saw double digit increases for at least one year, if not both.
This is actually a good sign for Moncks Corner real estate–it is a more healthy, stable rate of appreciation. Will Moncks Corner continue to appreciate at a stable level, or could Moncks Corner see a giant leap in appreciation for 2015?
A couple more stats might give us some insight to this question. Here is the Average Days On The Market (DOM):
The Average DOM was all over the place in 2014, and is on the upswing towards year end. December saw the Average DOM increase for the fourth consecutive month.
In November it was 100 DOM and December was 121 DOM. The highest Average DOM for 2014 was February and May with 127 DOM, and the lowest came in June with 76 DOM.
Here is a comparison of the Average DOM for 2014 versus the previous years:
While that number came down in 2014, it was a slight drop. Overall, the Average DOM is holding steady.
Next, a look at the Months Supply Of Inventory:
That number has been on the decline, dropping from 6.1 Months in November to 5.9 Months in December. That is significant because that puts Moncks Corner in a sellers market. Here’s why that matters:
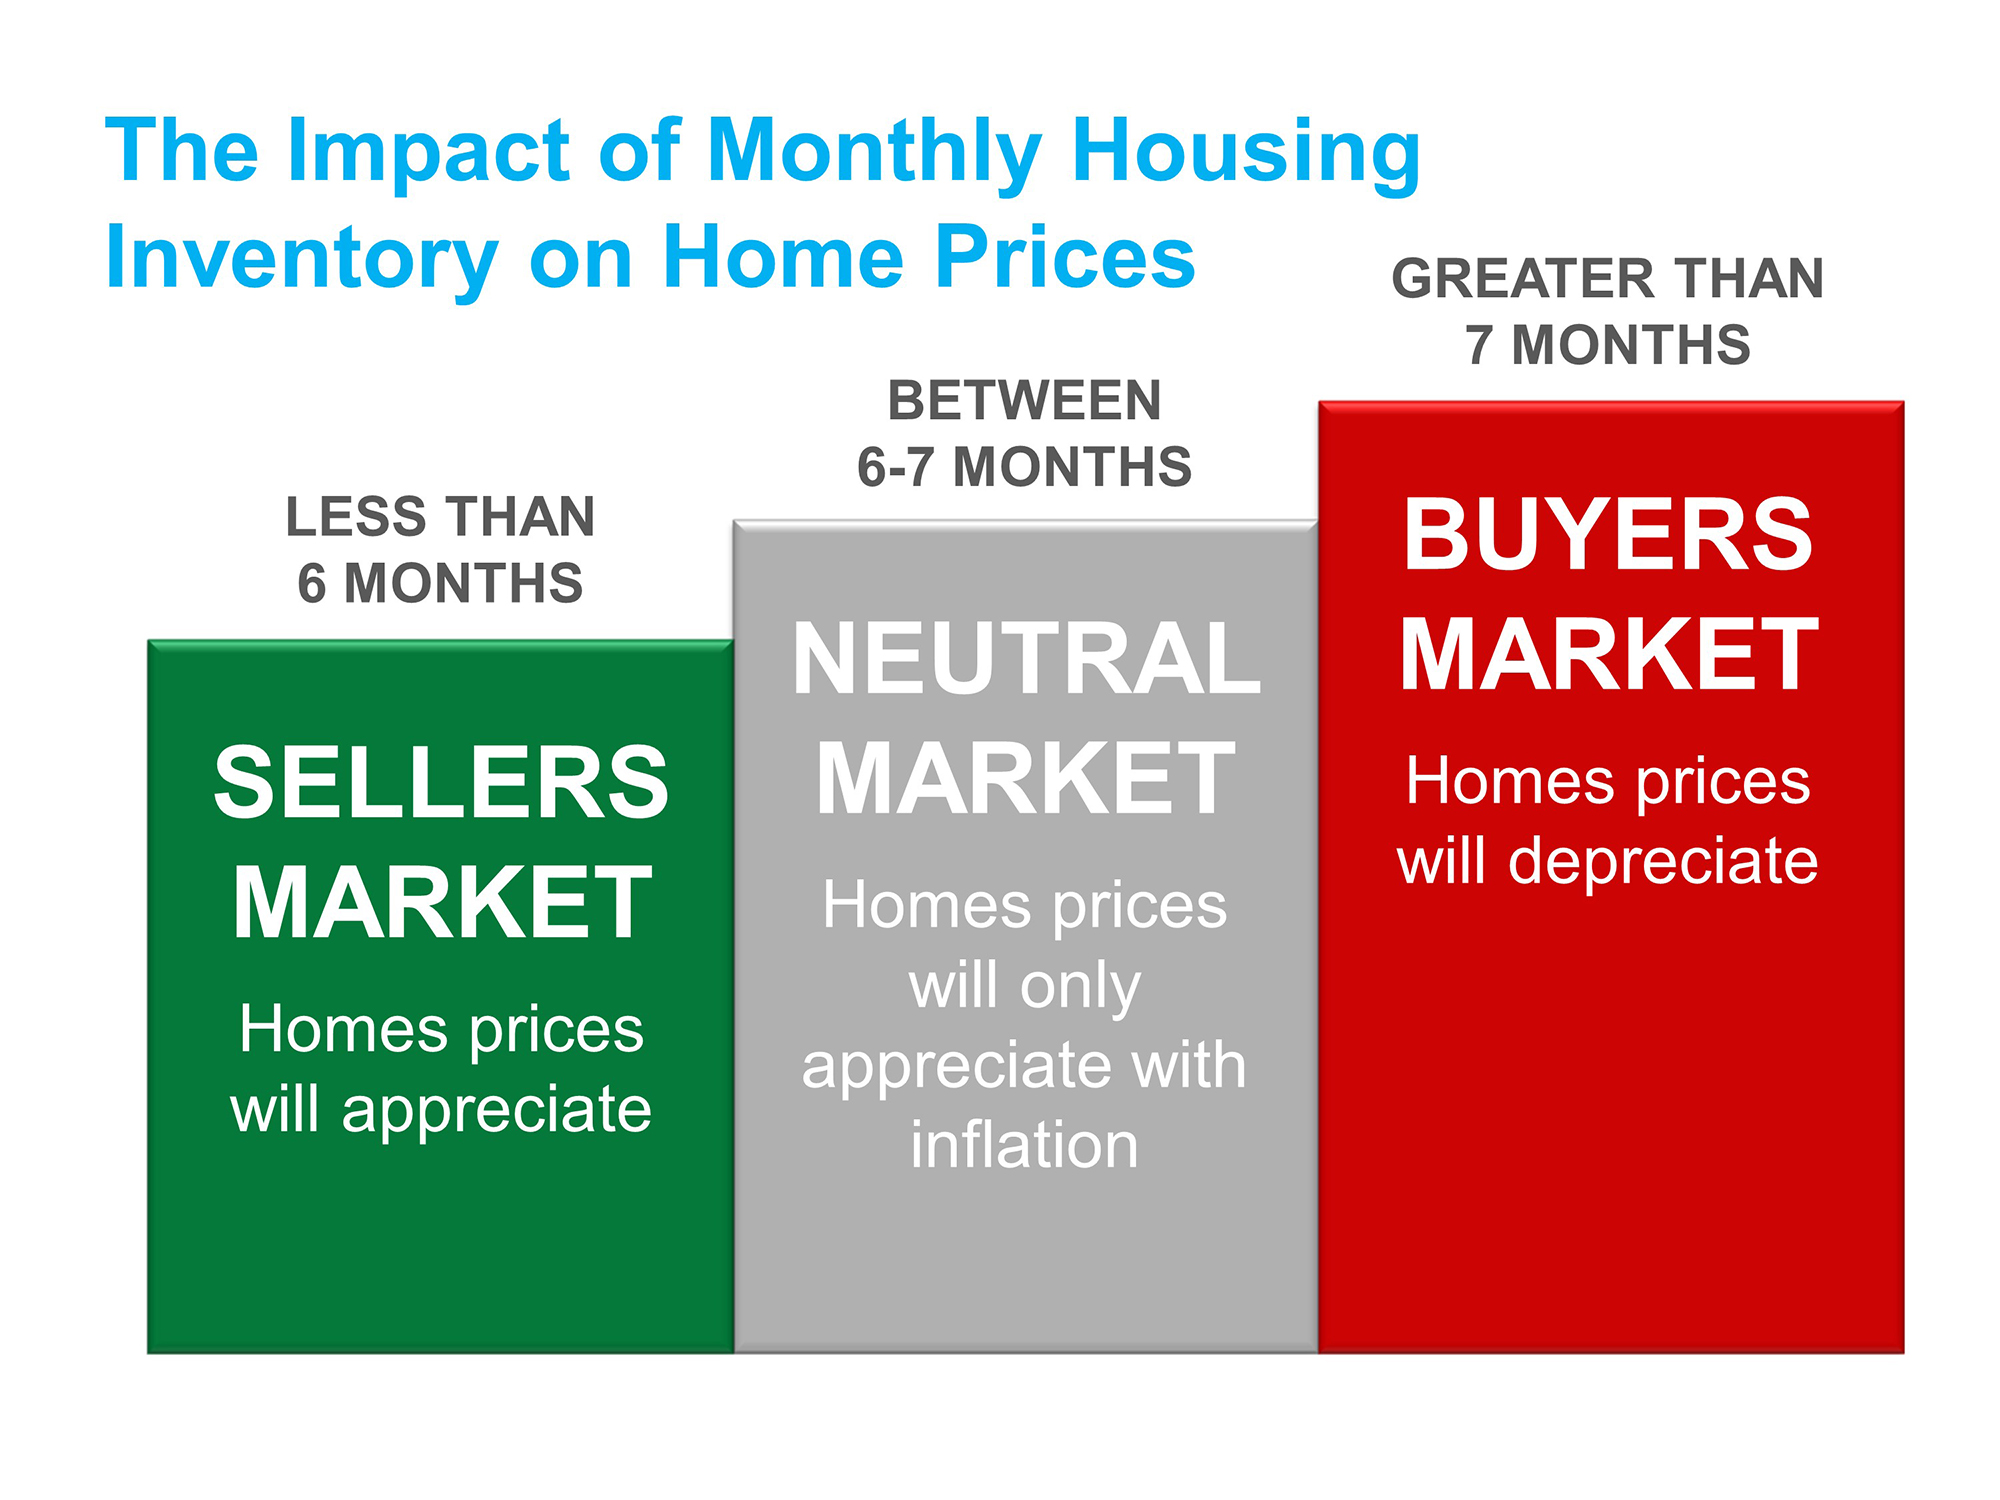
Obviously, December was the best month for Inventory Supply in 2014–the first month that dropped below the 6 Month threshold. The highest month was April at 8 Months Supply.
So, with Moncks Corner now just entering a sellers market, what did 2014 look like overall, compared to previous years?
That number has been declining, and overall for 2014, Moncks Corner real estate averaged a 7.1 Months Supply of Inventory. Much of the greater Charleston area has been in a sellers market the last year, and in some cases, the last 2 years.
Moncks Corner has just arrived to that point, yet sales have been on the increase and values have increased at a slower, but stable rate. It will be interesting to keep an eye on inventory in 2015 to see if there is enough to meet demand.
As of right now, there are 282 Moncks Corner homes for sale. In addition, there are 50 Pending Sales.
There are also 98 homes under contract. (Pending Sales are homes that are set to close, homes under contract–also known as Contingent–still have a contingency to get past in order to close).
In December, there were 69 new listings in Moncks Corner. These stats can give us a peak into the future numbers. Not all homes under contract will close, but over the next 60 days many will–and right now there are 148 homes that could be Closed Sales.
January is typically a slow month for most of Charleston. For Moncks Corner that has been true in years past. For the last 2 years, January hasn’t been too bad:
It looks like January 2015 will continue that trend, depending on when these homes close. However, it appears that Moncks Corner will continue the current trends heading into 2015.
A quick look at the Average Price Per Square Foot for the homes under contract shows that they average $90/sq ft. For 2014, the Average Price Per Square Foot was $87.
We won’t know what the sales prices of these homes are until after they close, so we are just going off the current list price.
It is interesting to note that half of the homes under contract (77) are New Construction. This is a good sign for Moncks Corner–new builders do their research and wouldn’t build if they didn’t see potential.
For buyers, it is a great time to buy in Moncks Corner. Interest rates are still low, and while prices are increasing, they are not doing so at a rapid rate. But, that could change.
For sellers, it is a good time to sell because Inventory has dipped below the level of meeting demand. One caution to sellers is the fact that there is so many new homes available. In fact, of the 282 Moncks Corner homes for sale, 115 of those are new homes.
New homes can be tougher to compete against, but that doesn’t mean you can’t sell your house. It is just more important that you price your home correctly, be sure to really amp up your curb appeal, and make sure you have an agent that will properly market your home.
Buyers can search the Moncks Corner MLS and also sign up to have a list of homes sent directly to their inbox. This list is constantly updated and includes prices, addresses, pictures and complete details.
Sellers should check out my sellers page and videos to see why I am the right agent to get your Moncks Corner home sold.
If you want to keep up with the latest stats on Moncks Corner, then visit my Moncks Corner Real Estate stats page.
Leave a Reply