
2017 (So Far) For North Charleston Real Estate
I’m continuing my series of stats for Charleston SC real estate markets,and today I am looking at the North Charleston real estate market stats for 2017 so far.
Buyer Stats
First, a look at the Average Sales Price:
January started off with an Average Sales Price of $191,388. That has increased each month in 2017. In February the Average Sales Price rose to $201,207, then in March to $205,017.
In April it increased to $206,570, and again in May to $210,926.
Here is a look at the Average Sales Price from 2016 vs. 2017:
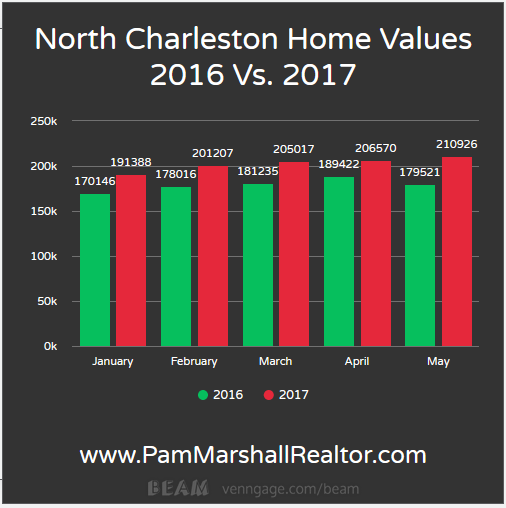
The peak month for 2016 came in October, when the Average Sales Price of North Charleston homes hit $204,266. We exceeded that in March of this year.
We also exceeded the previous high for North Charleston, which occurred in October of 2007, with an Average Sales Price of $204,970.
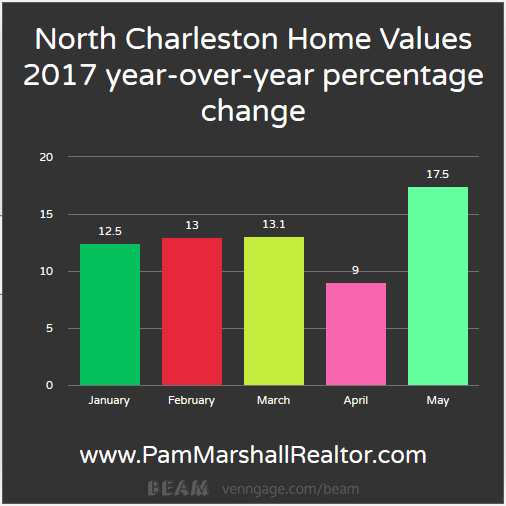
Here is a look at the year-over-year percentage change of Average Sales Price so far in 2017:
Pending Sales
Next up is a look at Pending Sales:
2017 kicked off with 140 Pending Sales in January. In February they dropped to 133, but in March shot back up to 158. In April Pending Sales decreased to 145, and again in May to 130.
Here is a comparison for Pending Sales between 2016 and 2017:
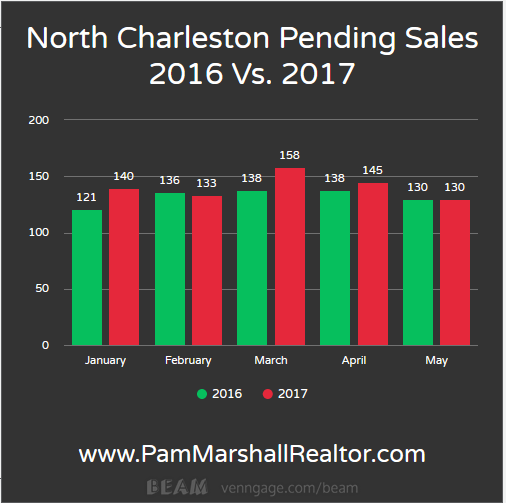
The peak month in 2016 came in March and April, each with 138 Pending Sales. March of 2017 was the highest amount of Pending Sales (158) since March of 2015, which saw 147 Pending Sales. The all time high occurred in May of 2006 with 184 Pending Sales.
Closed Sales
Next up is a look at Closed Sales:
January saw 96 homes for sale in North Charleston SC close. In February it increased to 113. March increased again, to 145 Closed Sales. In April it increased to 149, and in May it was up again to 159 Closed Sales.
Here is a comparison of 2016 vs. 2017:
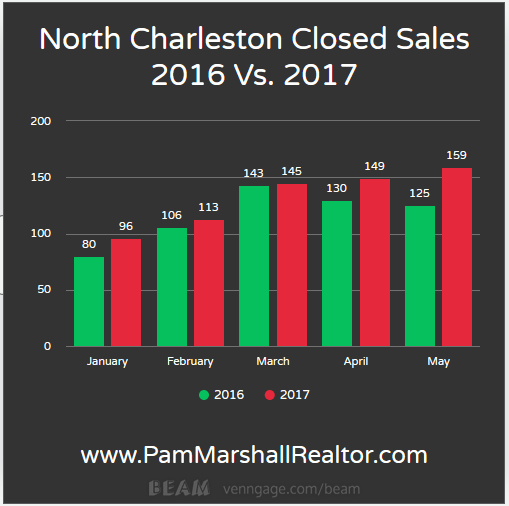
The peak month in 2016 was March, with 143 Closed Sales. That is the most since August of 2014 which saw 141 Closed Sales. The all time high happened in June of 2006 with 213 Closed Sales.
North Charleston Real Estate: Seller Stats
First up is a look at the Average Days On The Market (DOM):
January saw an Average DOM of 45 days. February the Average DOM increased to 50 days. March saw a slight drop off to 49 days, and April it dropped again to 41 days. The Average DOM increased in May to 48 days.
Here is a comparison of 2016 and 2017:
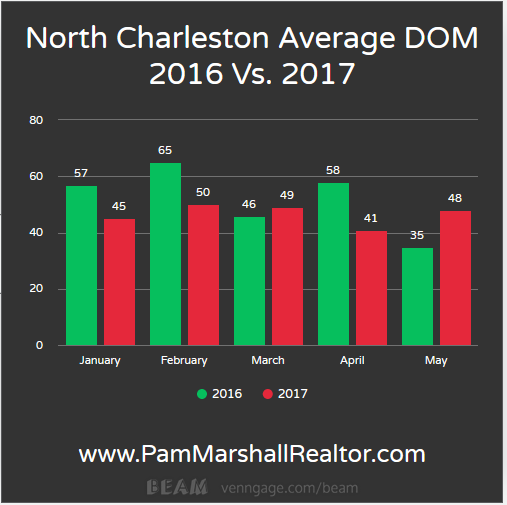
In May, November, and December of 2016 the Average DOM was 35 days. Those are the lowest months ever for North Charleston.
Months Supply Of Inventory
Next up is a look at the Months Supply of homes for sale in North Charleston SC:
January started the New Year off with a 2.9 Months Supply of homes for sale in North Charleston SC. In February it dropped slightly to 2.8 months.
March increased to 3.1 months, and in April it dropped to 2.7 months. May was also at 2.7 Months Supply.
Here is a look at Months Supply of Inventory between 2016 and 2017:
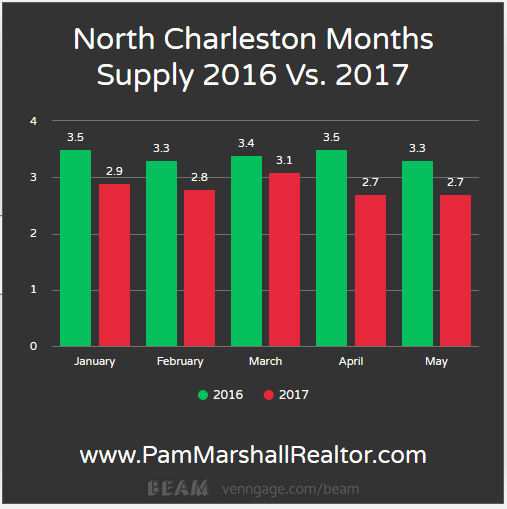
The shortest Months Supply of 2016 happened in December, which saw a 3.2 Months Supply. April and May of 2017 each had a 2.7 Months Supply, and that is the lowest ever for North Charleston.
North Charleston Real Estate: Current Numbers
First up is a look at the number of Homes For Sale in North Charleston SC:
In January there were 354 North Charleston homes for sale. That dropped in February to 343. March increased to 387, but dropped down to 346 in April. May saw another decrease, to 338 North Charleston homes for sale.
Here is a comparison of 2016 and 2017:
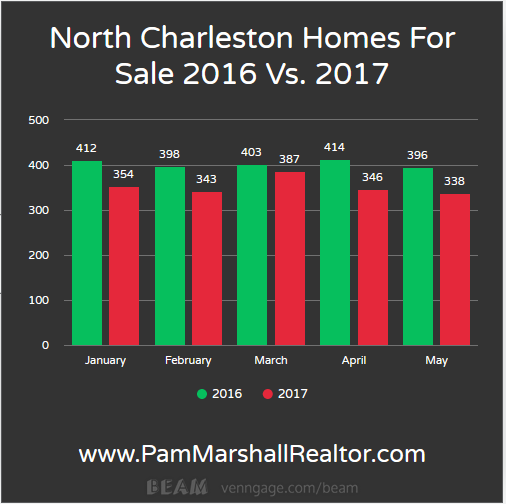
The peak of 2016 came in September and October, with 431 homes for sale. Of course that is a far cry from the all time high of 1,045 that occurred in June of 2008.
New Listings
Finally, a look at the New Listings to hit the North Charleston real estate market:
January saw 154 New Listings hit the North Charleston real estate market. February increased to 158. March shot up to 225. April saw a decline to 165 New Listings, and May also had 165 New Listings.
Here is the comparison of 2016 vs. 2017:
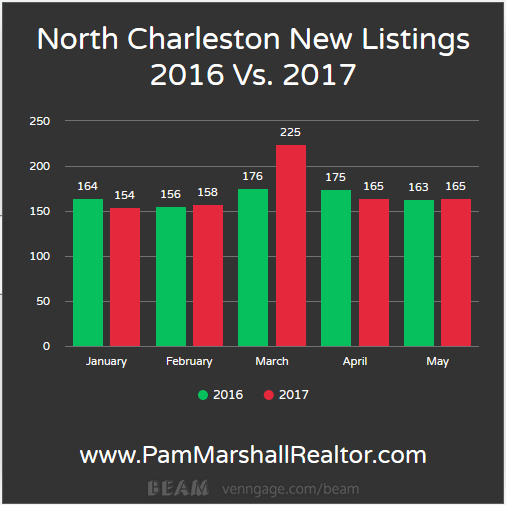
The peak of 2016 happened in July, with 181 New Listings. That was the most since July of 2015 which saw 191 New Listings. The most ever happened in January of 2007, with 320 New Listings.
So, How’s The Market?
The North Charleston real estate market closely resembles what is happening nationally: strong buyer demand and lack of inventory.
All of the buyers numbers are trending upward rapidly. Home values are way up, the number of Closed Sales is also trending rapidly upward.
Pending Sales have dropped over the last 2 months, but that is more likely to do with a lack of inventory rather than a lack of demand.
Days On The Market numbers hit their lowest point last year, and remain low. Months Supply of Inventory is also at an all time low.
It doesn’t look like the North Charleston real estate market will be getting to a normal market anytime soon. For that to happen, Months Supply of Inventory would need to get closer to 6 months.
The number of homes for sale in North Charleston have plummeted since last summer, despite a spike in March.
New Listings also saw a spike in March, but have leveled off. This is the time of the year for more listings to hit the market, but will there be enough?
For the immediate future, it looks like inventory will not keep up with demand. As a result, home values should continue to rise.
2017 has already seen the highest Average Sales Price in North Charleston, exceeding the peak during the real estate boom.
However, this does not mean we are heading for another crash. I covered this in greater detail in another post, but the buyer demand in this market is not artificially created. Nor is the market over saturated with listings.
Remember, the most Homes For Sale in North Charleston ever was June of 2008 with 1,045 homes.There are currently 292 homes for sale.
In June of 2008 there was a 12.8 Months Supply of homes for sale. That market had double the inventory of a normal market, so supply far outweighed demand.
To keep up with the latest stats and trends from the real estate market, subscribe to this blog and this blog.
You can download free real estate guides here.
If you are thinking about buying or selling North Charleston real estate, then be sure to visit my Pam Marshall Realtor website.
Leave a Reply