


Over the last month or so I have looked at the 2017 stats for various towns in the Charleston SC real estate market, so today I am continuing with a look at the Isle Of Palms real estate market.
Isle Of Palms Real Estate: Buying Stats
Closed Sales
First, let’s see how Isle of Palms houses for sale are faring:
In January, there were 20 homes sold on Isle of Palms. February also saw 20 Closed Sales, and March jumped up to 38.
April saw a decrease in homes sold to 28, and in May it slightly increased to 30. June dropped back to 28 Closed Sales.
Here is a comparison of 2017 and 2016, up to this point:
2016 started off slower, but quickly picked up pace. 2017 has been a little more consistent, with a spike coming in March. 38 Closed Sales is the most in 2017, so far.
However, the peak months in both 2015 and 2016 came in June, each seeing 36 Closed Sales.
While June of 2017 didn’t quite hit that mark, it wasn’t too far off at 28. Additionally, March of this year surpassed those peaks at 38.
Prior to June of 2015 and June 2016, the most homes sold in a month on Isle of Palms came in March of 2008 with 44 homes sold.
The all time high came in June of 2004, with 61 Closed Sales in the Isle of Palms real estate market.
Average Sales Price
Next up is a look at the Average Sales Price for Isle of Palms real estate in 2017:
January kicked off 2017 with an Average Sales Price of $824,675.
February saw it increase to $851,500. In March it dropped to $747,196, but in April it jumped up to $907,907.
May saw another increase to $975,124 before dropping again in June to $899,714.
Here is a look at 2017 Average Sales Price compared to 2016:
Here is a look at the year-over-year price change percentages for 2017:
February of 2016 was the highest Average Sales Price for Isle of Palms houses for sale since February of 2010, which saw an Average Sales Price of $1,456,611.
The highest all time happened in May of 2009, at $1,910,125.
Pending Sales
Here is a look at Pending Sales for Isle of Palms real estate in 2017:
January saw 21 Isle of Palms houses for sale go under contract.
That number increased to 35 in February, then dipped a little to 32 in March.
April declined again to 27, May also saw 27 Pending Sales. In June Pending Sales increased to 30.
Here is a comparison of 2017 vs. 2016:
The peak month for 2016 was August, which saw 33 Pending Sales. That was the most April of 2015, with 37.
Before that, the most Pending Sales in one month happened in April of 2008, also with 37.
The all time most Pending Sales for Isle of Palms real estate was in March of 2005, with 57 homes under contract.
Isle of Palms Real Estate: Selling Stats
Next up is a look at the Average Days On The Market (DOM) for Isle of Palms houses for sale:
January saw the Average Days On The Market for Isle of Palms at 170 days. In February that increased to 183 DOM.
March dropped to 113 days, then it increased in April to 127.
May saw an Average DOM of 111 days, and June increased to 119.
Here is a look at 2017 compared to 2016:
2016 saw a much greater disparity in Average DOM than 2017.
The highest Average DOM came in January of 2016 at 246 DOM, and the lowest was in July at 102 DOM.
The largest and lowest Average DOM for Isle of Palms real estate also happened in a short time span.
November of 2007 saw an Average DOM of 465 days, but that quickly dropped to 26 DOM in March of 2008.
Months Supply Of Inventory
Next up is a look at the Months Supply of Inventory of homes for sale Isle of Palms SC:
The Months Supply numbers remained roughly in the same range in both 2016 and 2017, although 2017 has been in a lower range.
January saw a 9.1 Month Supply, then it dropped to 8.2 Months in February.
Since then it has been 8.8 Months (March), 8.5 Months (April), 8.8 Months again (May), and then 8.7 Months (June).
2016 was similar, although the Months Supply ranged from 11.2 Months to 13 Months.
Here is a comparison of 2017 to 2016:
The lowest Months Supply of Isle of Palms houses for sale was in December 2004 through February 2005, with each month having 2 Months Supply.
The highest came in April of 2009 with a 69 Month Supply of inventory.
Isle Of Palms Real Estate: Current Stats
To wrap up this update, here is a look at the current numbers from the Isle of Palms real estate market.
Here are the Current Listings of homes for sale Isle of Palms SC:
January saw 199 Isle of Palms houses for sale. That dropped to 188 in February, then increased in March to 207.
April saw a slight decrease to 202, then back up to 206 in May. June saw 213 Isle of Palms houses for sale.
Here is a comparison of 2017 and 2016:
The most homes on the Isle of Palms real estate market came in August and September of 2007, each with 570 active listings.
The fewest? That happened in December of 2004 with 77.
New Listings
Finally, a look at New Listings to hit the Isle of Palms real estate market in 2017:
In January, there were 32 new Isle of Palms houses for sale. In February, that increased to 37.
March saw a further increase to 59 New Listings, and in April it dropped to 34.
May increased to 43 New Listings, and June saw another increase to 52.
Here is a look at 2017 compared to 2016:
March of this year saw the most New Listings in 2017, with 59. That is still short of the peak of 2016, which came in March also, with 62 New Listings. ‘
That is the most since August of 2010, which saw 81 New Listings added to the Isle of Palms real estate market.
The most all time happened in August of 2007 with 146 New Listings.
Bottom Line
If you have seen the headlines across the country, you probably know that the real estate market overall is doing very well. Home values continue to skyrocket as supply is way behind the demand that exists out there.
Yet, looking at the numbers for the Isle of Palms real estate market, that doesn’t appear to be the case.
Home values have fluctuated, both this year and last year, and the Months Supply numbers are way above the national average.
So what gives?
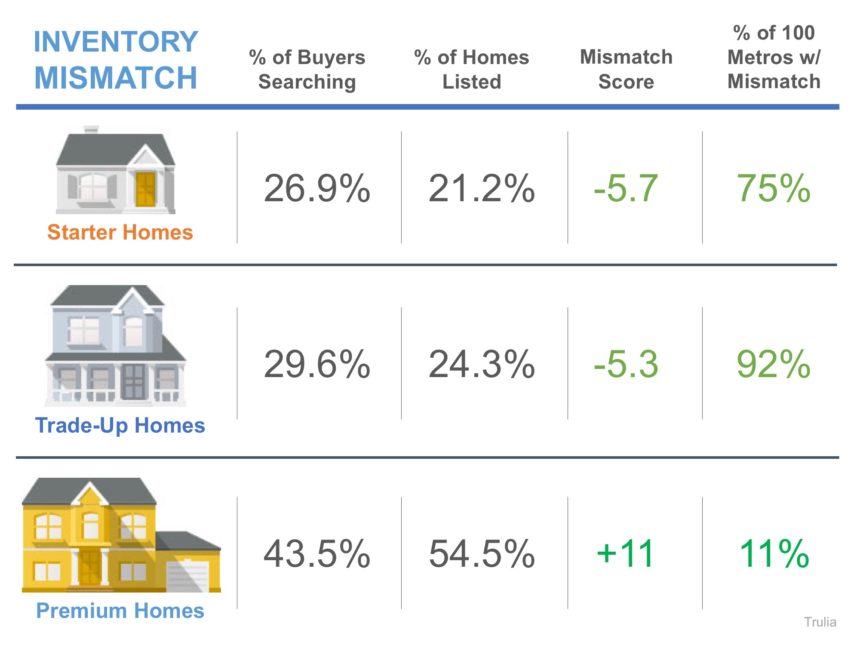
What a lot of the mainstream media is failing to point out is the fact that we actually have two separate and completely different markets happening right now.
The market for starter homes and move up homes is hot. The market for the higher end is completely the opposite.
 You can read about it in more detail here. In a previous post I looked into this in the Charleston market.
Fact of the matter is, the higher end real estate market is not seeing the same trends as the rest of the market.
And that is reflected in what is happening in the Isle of Palms real estate market.
Home values have fluctuated, and not just in 2017.
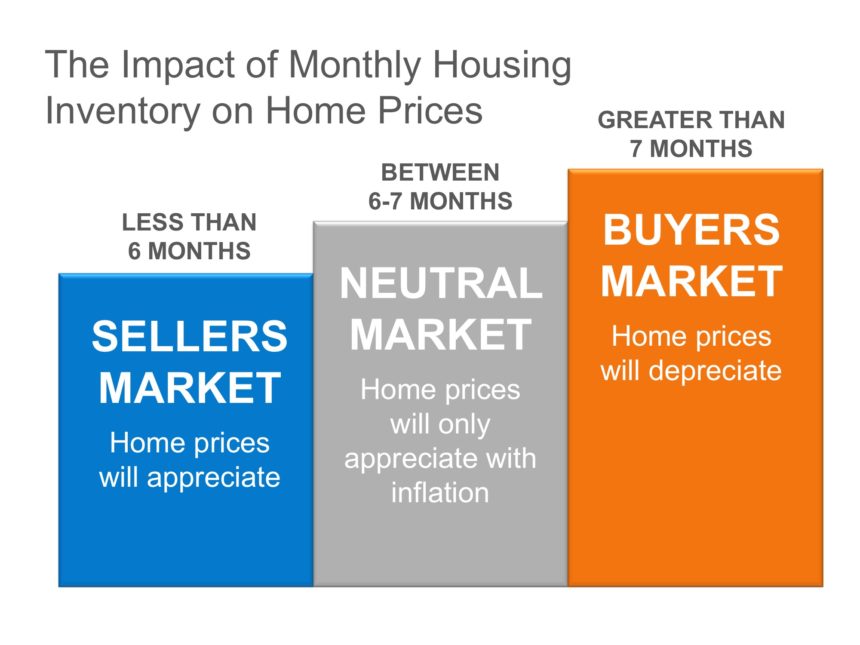
The other key statistic is the Months Supply of Inventory.
Isle of Palms is in the 8-9 month range, down from the 11-13 month range of last year. While that number is down, it is still nowhere near the national level that has been in the 3-4 month range.
And it is still higher than the 6 month supply that indicates a balanced market. Basically, Isle of Palms is in a buyers market.
Buyer And Seller Strategy
Buyers of Isle of Palms houses for sale are in a good position. They do not have to worry about homes being snatched up as soon as they hit the market.
They do not have to worry about bidding wars, so their negotiating options remain wide open.
Sellers on the other hand need to be aware of what is happening in the higher end market nationally, as well as with the Isle of Palms real estate market locally.
If they just read some of the real estate news out there, they might mistakenly believe that the shortage of inventory, strong buyer demand, and skyrocketing values apply to all homes.
And that assumption would set them up for disappointment and frustration.
If you are thinking about selling your Isle of Palms home, then it is important that you know what is happening in your backyard.
It would also be smart to make sure to choose the right agent to list your home. You do not want to hire an agent that doesn’t understand that the Isle of Palms market is completely different than what is happening in the rest of the Charleston market.
Otherwise, your selling strategy will be completely wrong, as well as your expectations. Chances are, your results (or lack thereof) will be, too.
Be sure to visit my Pam Marshall Realtor website for more information about buying or selling.
There are helpful videos, and you can download one of my free real estate guides.
Stay tuned to the latest real estate stats, news, and trends on this blog or this blog.
Leave a Reply