


Daniel Island Real Estate Stats: A Closer Look Into The Numbers
Today I am looking at Daniel Island real estate stats from the Daniel Island MLS. Here is a look at November stats, as well as stats going back to the beginning of 2013 so you can see the market trends. The first stat I want to look at is the Average Price:
The Average Sales Price for homes for sale in Daniel Island rose in November to $770,997. That is up from October, in which the Average Sales Price was $579,356. As you can see in the graph, November is the highest price point since the beginning of 2013.
Next, let’s look at the number of Closed Sales:
The number of Closed Sales dropped in November, from 31 in October to 20. May and June were the peaks for 2014 with 37 Closed Sales. The low point was January, with 15. Over the last nearly two years, the most sales for Daniel Island real estate in a month was June 2013 with 45.
A good indicator of future sales is the Pending Sales. These homes are under contract and will close sometime in the next 60 days. Often, the graph for Closed Sales will closely resemble that of the Pending Sales.
For November, there were 19 Pending Sales. That number is down from 21 in October. It is also the lowest number for 2014. The peak month was April with 37 Pending Sales.
Another important number is the Average Price Per Square Foot. This number is used as a basis of comparison for homes to determine value. Since homes vary in location, size, age, etc. this number allows us to try and compare apples to apples.
Just like the Average Sales Price, the Average Price Per Square Foot is on the upswing. In November, the Average Price Per Square Foot was $242/sq ft. That was up from October’s $219/sq ft. Just like the Average Sales Price, November was the highest month since the beginning of 2013.
The next stat is the Average Days On The Market (DOM). That number rose in November, to 78. In October it was 62.For 2014 that number was as low as 30 (August), and as high as 123 (April). The highest DOM in the last couple years was 145 in July of 2013.
Finally, let’s look at the Months Supply of Inventory:
That number rose slightly in November, up from 3.3 months to 3.6 months. That number has been on the decline. In fact, October was the lowest number in the last 2 years. March of 2013 was the highest point at 6 months.
Why is this number important? The Months Supply lets us know what type of market we are in. This is easier explained by this infographic:
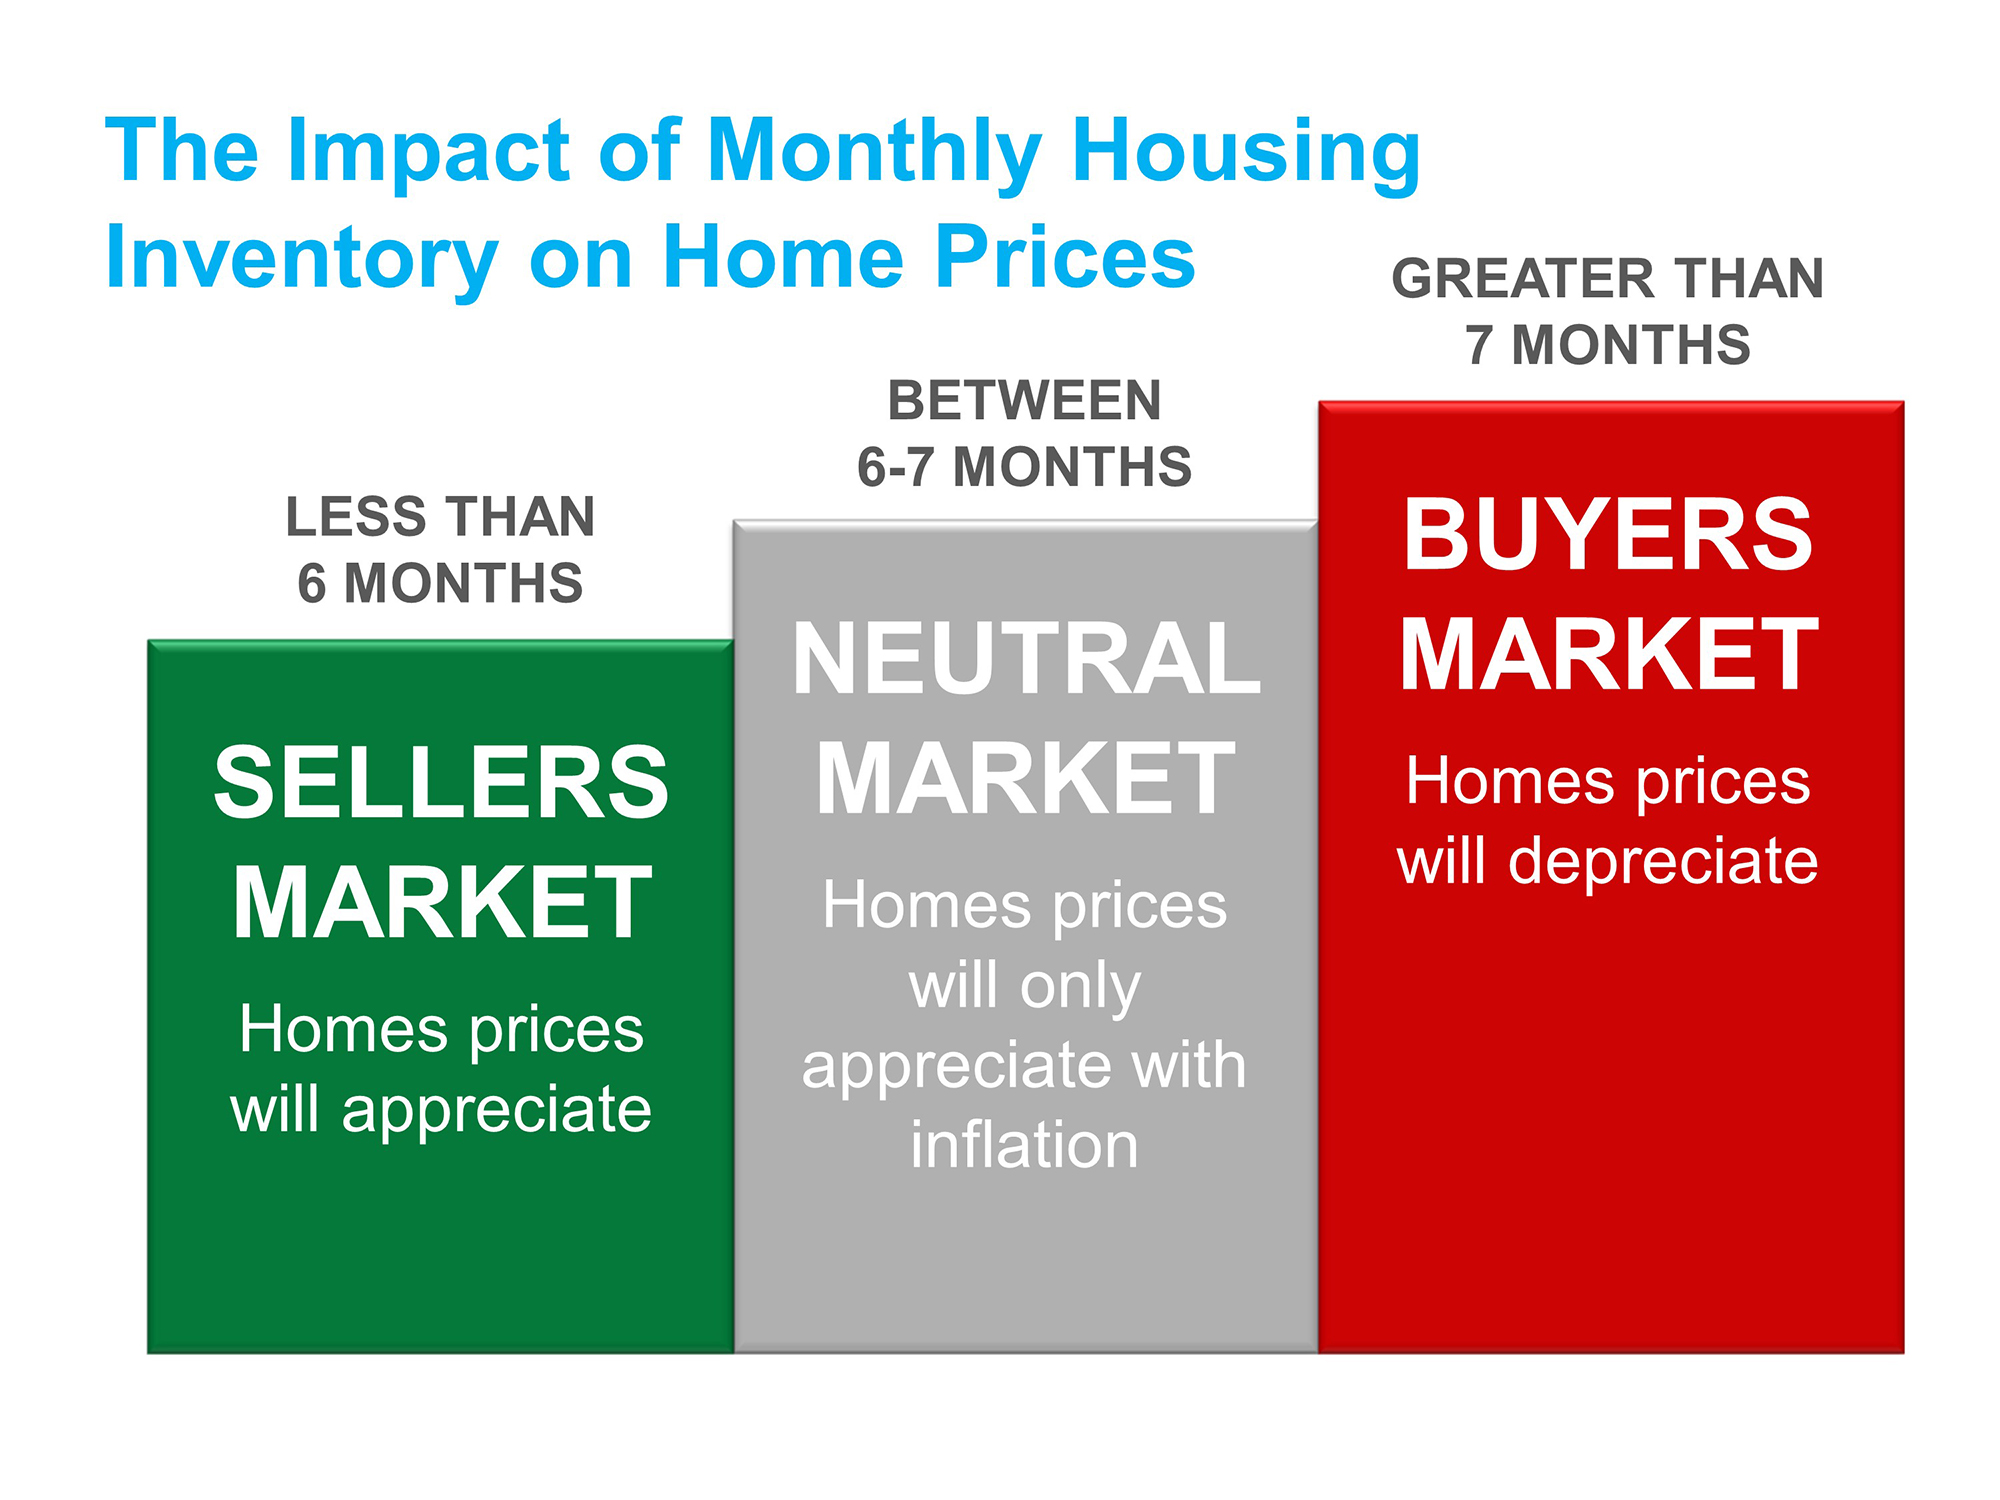
As you can see, Daniel Island is currently a seller’s market.
So, just what does all this data mean? Overall, the market on Daniel Island is doing very well, and the next chart shows that. This is the year-to-year Average Sales Price for November the last 3 years:
As you can see, there was a 36.3% increase in Average Price from last year. So, while the number of sales are down, the values continue to rise. This is a simple case of supply and demand.
The number of homes for sale has declined, so the inventory isn’t keeping up with demand. However, there were 100 homes available for sale in November, and that number has been on the decline:
So, with Closed Sales down to 20, and with 100 homes available, why weren’t there more closings? A quick look at the current homes for sale in Daniel Island show that the Average Price Per Square Foot is $270/sq ft–well above the November average of $242/sq ft. Remember, November was the highest number in nearly 2 years.
Of the 95 currently active listings, 51 are priced above $242/sq ft. Those homes also average 153 DOM, which is well above the November Average DOM of 78.
Now this isn’t to say all homes should be priced at or below $242/sq ft–like I said, that number is a good way to try to compare apples to oranges. But, the fact remains that many homes for sale in Daniel Island are overpriced.
Daniel Island Real Estate Stats: What Does This Mean For Buyers and Sellers?
This can be good and bad for buyers. On one hand, you may have unreasonable sellers who will not come off their price. On the other hand, many sellers want to sell. They have been on the market a long time, and armed with this data, a buyer can justify an offer lower than list price.
A sensible seller will understand this, and this can lead to a good deal for both parties. And often, a seller that has been listed for a long time is itching to sell, so the buyer could get a home at a below market price.
The fact that values continue to rise is another good sign for buyers. The home they buy today will continue to increase in value, so they will be able to build equity.
For sellers, it is very simple. One factor of selling a home is competition. But as you can see, the demand is there. Values are increasing. There are 95 homes on the market, but you are not necessarily competing against all of them.
If you sell and do what I am always preaching–know the market numbers and price your home accordingly from the start, you will have a big leg up on the competition. In fact, you will be ahead of much of the competition and should see a quick sale–around 80 days.
If you are searching for homes for sale in Daniel Island, then be sure to check out my Daniel Island MLS page.
If you are thinking about selling, then it is important that you choose the right Realtor. One who understands the market data and knows marketing. Because those are the 2 most important factors in selling a home–correct price and marketing. Be sure to check out my sellers page.
You can also go online and see an Instant Home Value Estimate here. You can also request a more Comprehensive Neighborhood Market Analysis.
Either way you can see up-to-date market stats on my Daniel Island Real Estate stats page
Feel free to contact me for all your Daniel Island real estate needs!
Leave a Reply