

Home Sales: Fastest Pace In Years For Much Of Charleston
The National Association of Realtors most recent Existing Home Sales Report showed that home sales are up, and the pace at which homes are selling have also increased.
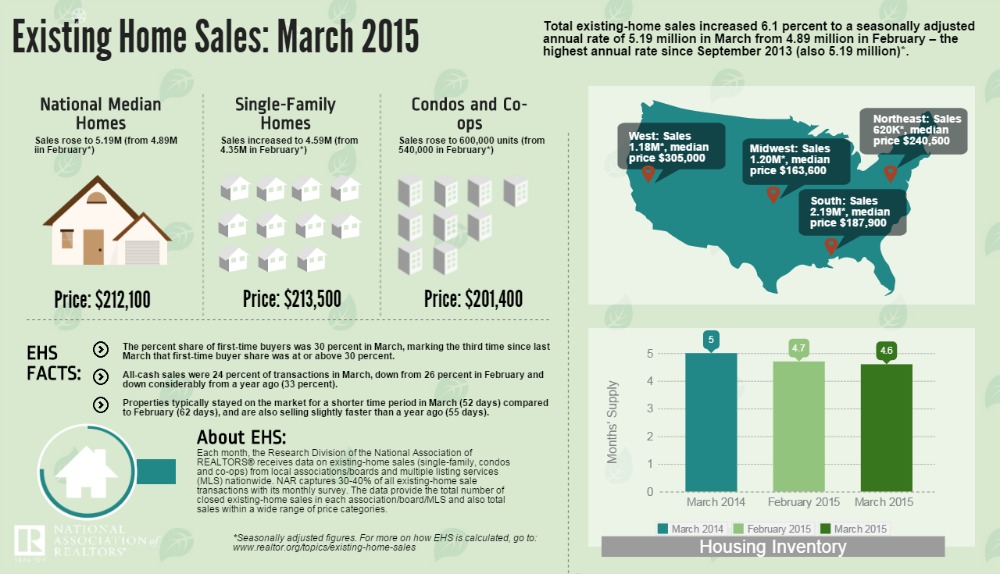 The Average Days On The Market (DOM) for home sales nationally was 52 DOM for March. This is down from 62 DOM in February, and also down from the 55 DOM in March of 2014.
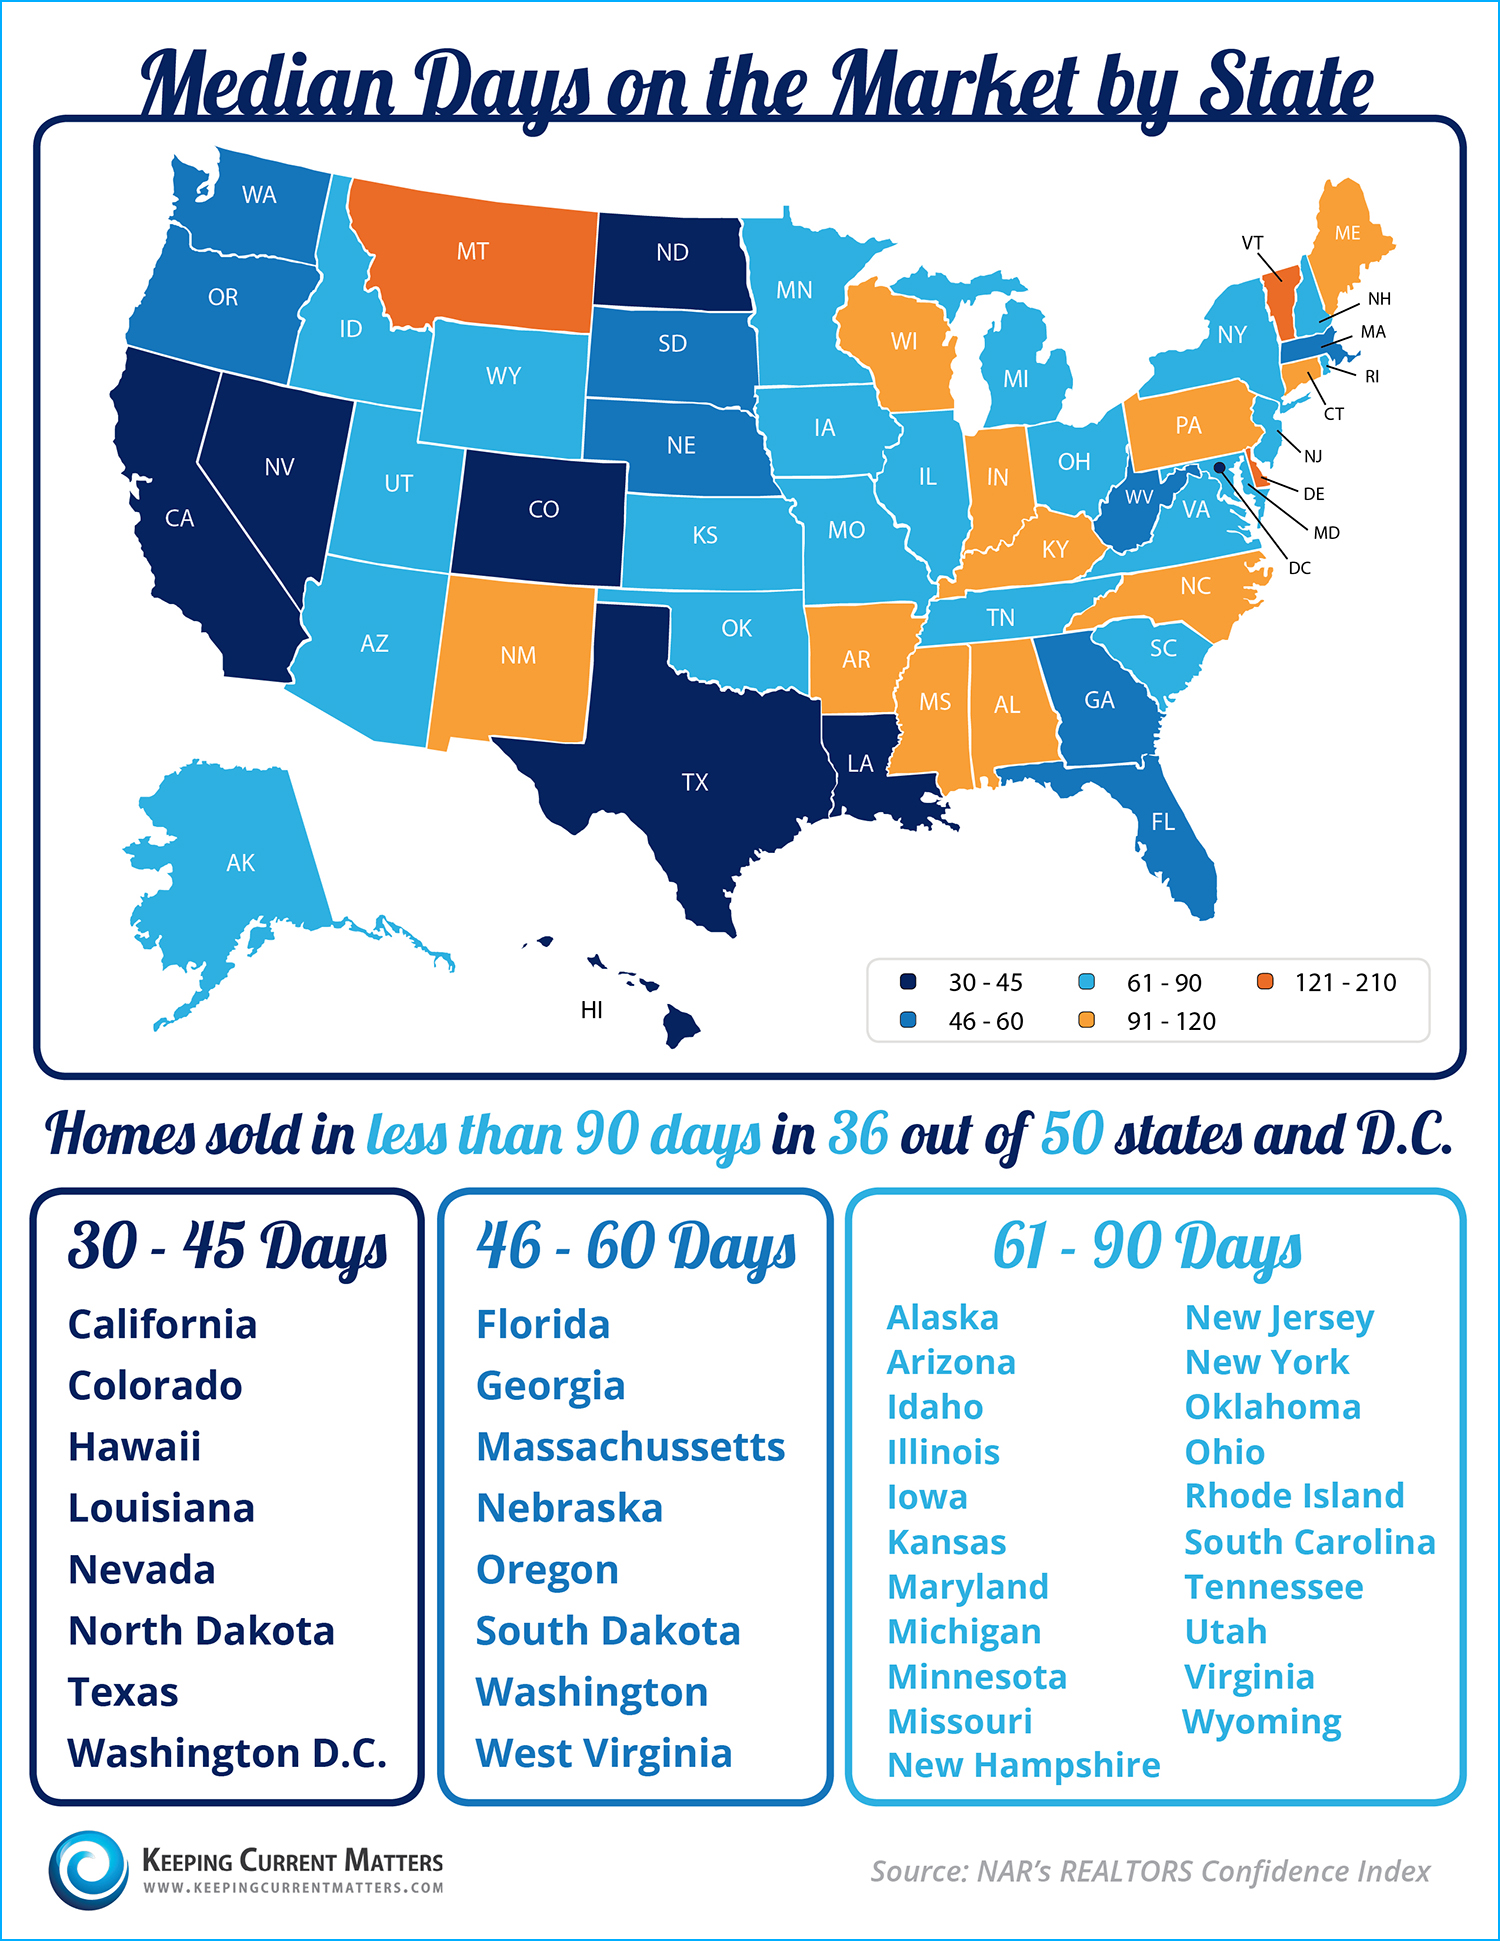 In fact, for 36 out of 50 states, the median DOM is under 90 days.
This is reflected in the fact that the Months Supply of Inventory dropped in March, from 4.7 Months in February, to 4.6 Months.
As you can see in the above infographic, South Carolina is averaging home sales in the 61-90 DOM range. So, how are we looking here in Charleston?
Over the last few weeks I have been posting market updates for various parts of the Charleston MLS, including the entire MLS overall.
Here is a look at the most recent DOM numbers for the Charleston MLS:
February to March saw an increase in DOM, from 68 to 73. However, in April it dropped to 67 DOM. That is the lowest it has been since September 2006 at 59 DOM.
Here is a quick rundown on the Average DOM for each city’s home sales in the MLS:
North Charleston: In February, the Average DOM was 69. It dropped in March and April, to 61 DOM and 57 DOM, respectively.
April is the lowest DOM since June 2013, which also saw a 57 DOM average.
Prior to that, the lowest DOM was in September 2006 at 53 DOM.
Goose Creek: In February the average DOM was 62. In March it dropped to 58 DOM, and is up slightly for April at 60 DOM.
Back in November Goose Creek hit a low DOM of 50 and that was the lowest month since September 2007 at 46 DOM.
Mt Pleasant: In February the average DOM was 53. In March it increased to 71 DOM and dropped in April to 64 DOM.
Back in August it hit 47 DOM, the lowest point since January 2006 at 40 DOM.
Summerville: In February the average DOM was 53. In March it increased to 67 DOM and dropped in April to 62 DOM.
February was the lowest month since August 2006 at 51 DOM.
Hanahan: February was at 99 DOM, but has dropped to 66 DOM in March and 58 DOM in April. That is still not as low as January 2014, which had an average DOM of 26.
That was the lowest month since September 2006 at 23 DOM.
James Island: James Island has seen a dramatic drop in DOM. In February, it was 122 DOM. That dropped in March to 51 DOM, and again in April to 27 DOM.
James Island has seen lowers DOMs, including June 2013 (11 DOM), November 2012 (7 DOM), September 2012 (3 DOM), and February 2012 (22 DOM).
Prior to those months, the last time James Island had an average DOM under 27?
All the way back to October 2006 at 20 DOM.
Johns Island: Johns Island looks to be bucking the trend. In February the average DOM was 53, and it dropped in March to 43 DOM.
In April, it shot up to 94 DOM. However, in January it was 29 DOM and that was the lowest since November 2006 at 22 DOM.
Isle Of Palms: In February the average DOM was 135. In March that shot up to 175 DOM, and then in April it is back down to 134 DOM.
February 2014 was the low point for the year at 105 DOM, and IOP saw a DOM of 98 in January 2013.That was the lowest since April of 2008 at 87 DOM.
Sullivans Island: In February there was an average DOM of 98. In March, that increased to 107 and then again to 109 DOM in April.
In February of last year there was actually a DOM of 0, and that is not the first time that happened.
Daniel Island: February had an average DOM of 41. That increased in March to 80 DOM and dropped in April to 60 DOM.
February wasn’t as low as 2014’s low, which came in August at 30 DOM. That was the lowest since May 2005, also at 30 DOM.
Moncks Corner: February saw an average DOM of 72, and that increased in March to 92 DOM. That dropped in April to 65 DOM.
That is not quite as low as November 2013 at 63 DOM, which was the lowest month since June 2010 at 51 DOM.
City of Charleston: In February the average DOM was 67 DOM, and that increased in March to 75 DOM. It dropped in April to 58 DOM.
April is the lowest since July 2006 at 55 DOM.
Overall, the numbers are looking good locally–in most cases better than the national and state numbers.
Despite the strong buyer demand, despite the numbers for Home Sales and Pending Home Sales increasing, and a drop in both the Months Supply and Average DOM, it is still important for home sellers to make sure that they still take the proper steps when listing a house for sale.
Price it right (from the start), fix any issues ahead of time, and make sure your home really shows well.
Despite the numbers, buyers still are overlooking overpriced homes, and really do not want a home that “just needs a little TLC”.
Getting a home sold on this market still takes some effort. There are 5,419 homes currently for sale on the Charleston MLS, and of those, 2,821 have been listed for 67 days or longer (the average DOM for the Charleston MLS).
They could be overpriced, they may be in bad condition, but fact is they are still on the market. So, it is not as simple as putting out a for sale sign and waiting.
Which brings up another important aspect to selling a house: properly marketing it. You have to get it out to where the home buyers are–on the internet.
To learn more about my internet focused strategy to attract buyers, visit my Pam Marshall Realtor website and learn more about your house can become one of the successful home sales this year.
Leave a Reply