Isle Of Palms Real Estate Stats: Home Values Are Way Up!
Once again it is time to look at the Charleston MLS for Isle of Palms real estate stats to see how the market is doing. First, a look at Closed Sales:
The number of Closed Sales is down for November, from 19 in October to 14. April was the peak month for 2014 with 24 Closed Sales, and June wasn’t too far behind with 23.
By the looks of that graph it might appear that overall sales are down from last year, but this graph better illustrates that isn’t the case:
Next, let’s take a look at Pending Sales:
Pending Sales also saw a drop in November, down to 16 from 20 in October. April was the 2014 peak month, with 26 Pending Sales. So, with Closings down, how are the values? Here is a look at the Average Price:
November saw home values shoot up to over a million dollars. In October the Average Sales Price was $882,603. In November it was $1,028,279.
That was the peak for 2014, and almost was the best number since the beginning of 2013. However, in August of 2013 the Average Sales Price was $1,057,000.
Here is something very good regarding Isle of Palms values. Compared to last November, the year-to-year increase in home values has soared–by 43%!!
Here is a look at the Average Price Per Square Foot on Isle of Palms:
In November the Price Per Square Foot shot up, from $362/sq ft to $441/sq ft. That is an increase of of 21.8% in just one month!
Now, let’s take a look at important numbers for sellers. First, the Average Days On The Market (DOM):
The good news is that number is declining. In September it was 231 DOM. In October it dropped to 147 DOM and in November it was 120 DOM. July was the highest DOM for 2014 at 254.
If you look back to February of 2013 it was as high as 294. February of 2014 was the lowest DOM (105) in the past 2 years, other that January of 2013 with 98 DOM.
Here is a look at the Months Supply of Inventory:
That number is on the decline, yet it remains high. For November, Isle of Palms saw a 14.2 Month Supply of Inventory. That is down slightly from the 14.6 Month Supply in October. The peak for 2014 was September, with a 15.5 Month Supply.
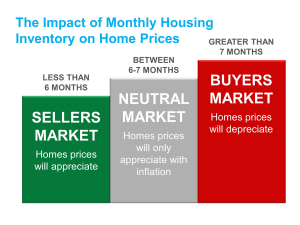
So, it’s good that the number is on the decline, but it remains higher than we would like to see. In fact, much of the Charleston area is under a 6 Month Supply, which is the threshold for a sellers market. Once again, I break out my handy infographic that explains this:
By reading that graphic you have probably already spotted what’s wrong with the numbers.
Isle of Palms is technically a buyers market, so by that definition, values should be declining.
However, as you can see by the graphs above, the complete opposite is true.
Currently, there are 119 Isle of Palms homes for sale. 79 have been listed for 120 days or longer. 57 have been listed for 200 days or more.
My first thought was that possibly some new, custom built homes may explain this. It isn’t unusual for builders to not list a new home until after it is sold–they will add the comp to the MLS after it is sold.
This can skew the DOM numbers, and often these homes are higher priced homes.
However, that is not the case. It will be worth watching the Isle of Palms MLS over the next month or two to see what happens to the numbers–if the values continue to increase.
More than likely, it would be better to look at each house on a case-by-case basis to get more refined, specific numbers.
So, what do these numbers mean to buyers and sellers of Isle of Palms real estate? For buyers, it is a double edged sword. Increasing values are a good sign–Isle of Palms homes for sale are an appreciating investment.
However, if they continue to appreciate, especially at this rate, buyers can miss out on potential equity. Plus, by waiting, the price just keeps getting higher.
For sellers, it would be especially important to look at the numbers closer to their home and see what they tell. By these numbers it is a very competitive market. In November, two homes had DOMs of 3 and 13.
So, getting a quick sale is by all means possible. But, a seller might want to understand that the Average DOM is still 120 days, so patience and caution are necessary.
Depending on what homes you will be competing against will determine your sales strategy. It might not be a bad idea to offer some incentives–such as paid closing costs (all or a portion), or a selling agent bonus. Something to stand out.
But again, first sellers should see what more specific numbers to their home tell before determining the best path to getting sold.
If you are thinking about buying or selling Isle of Palms home for sale, then I have some resources for you. For buyers, you can search my Isle Of Palms MLS page to search available homes.
You can also sign up to receive a free list of homes sent to your inbox. This list will have prices, addresses, pictures, a Google map link as well as complete home details.
This list is updated with updated and new listings in real time so that you will know about all Isle of Palms homes for sale.
For sellers, be sure to check out my sellers page.
If you want to keep up with the market stats for Isle of Palms, then you can get the latest numbers, updated in real time, at my Isle Of Palms real estate market stats page.


Leave a Reply