

North Charleston Real Estate Stats: What’s Going On In North Chuck
Today I am looking at data from the Charleston MLS for stats from the North Charleston real estate market. First, here are the latest Closed Sales:
Closed Sales have been on the decline since they peaked in August with 141 Closed Sales. In November, the number of sales dropped to 80, down from 106 in October. This has been the trend for many parts of Charleston, although sales overall for the year have been up over last year. Here is a comparison of year-to-year sales for the last couple Novembers:
As you can see, we are ahead of last years numbers, up by 11.1%.
Now let’s take a look at the Pending Sales:
That number has taken a sharp drop, down to 83 in November from 114 in October. July was the peak for 2014 with 123 Pending Sales. So, how has the declining sales numbers affected values?
Here is the Average Sales Price:
The Average Sales Price is up to $154,154 in November, up from October’s $151,158. That number dropped off from the 2014 peak in August, which was $179,283. That was also the highest number in nearly 2 years.
Here is the Average Price Per Square Foot:
That number also increased, from $84/sq ft in October to $89/sq ft in November. August was also the peak month, for both 2014 and 2013, at $93/sq ft.
Average Days On The Market (DOM):
That number has also been on the decline, but it rose slightly in November–up to 66 DOM from 64 DOM in October. That number was the highest since the beginning of 2013 in June, with an Average DOM of 100.
Finally, a look at Months Supply of Inventory:
That number keeps dropping. In November it was 4.0. the same as October. However, that number has been declining since it was at it’s highest (in 2014) in March at 5.5 months of inventory. As you can see by the graph, even that number is lower than what we saw in 2013.
So, what does all this mean for North Charleston real estate?
If you have seen my other posts for different parts of the greater Charleston area, these graphs look very similar.

The number of sales are down–however, it is important to not rush to judgement and keep things in the proper perspective.
The sales have declined over the last couple months, but that decline is after peak numbers.
Sales in the greater Charleston area have shown to rise over Spring and Summer and decline into the Fall and Winter.
However, many areas, including North Charleston, have seen overall sales rise the last couple years.
This is merely a cyclical market, and not a declining market. In fact, the market is still rising. This is evidenced by the fact that values are continuing to rise.
North Charleston is a sellers market by virtue of having a Months Supply of Inventory under 6 months. In fact, since last October, North Charleston has been under a 6 Months Supply of Inventory.
As is typical in a sellers market, and clearly evidenced by the numbers, values continue to rise.
For buyers, despite it being a sellers market, it is a good time to buy. The increase in values is both a positive and negative. Increasing values means buying a house is a good investment. However, the longer you wait to buy, the more it will cost you. It is possible that the house you want today will not be affordable this time next year.
Not only are house prices increasing, but interest rates are as well. This can mean that if you wait to buy, you will not be able to afford as much house. The following infographic better illustrates this:
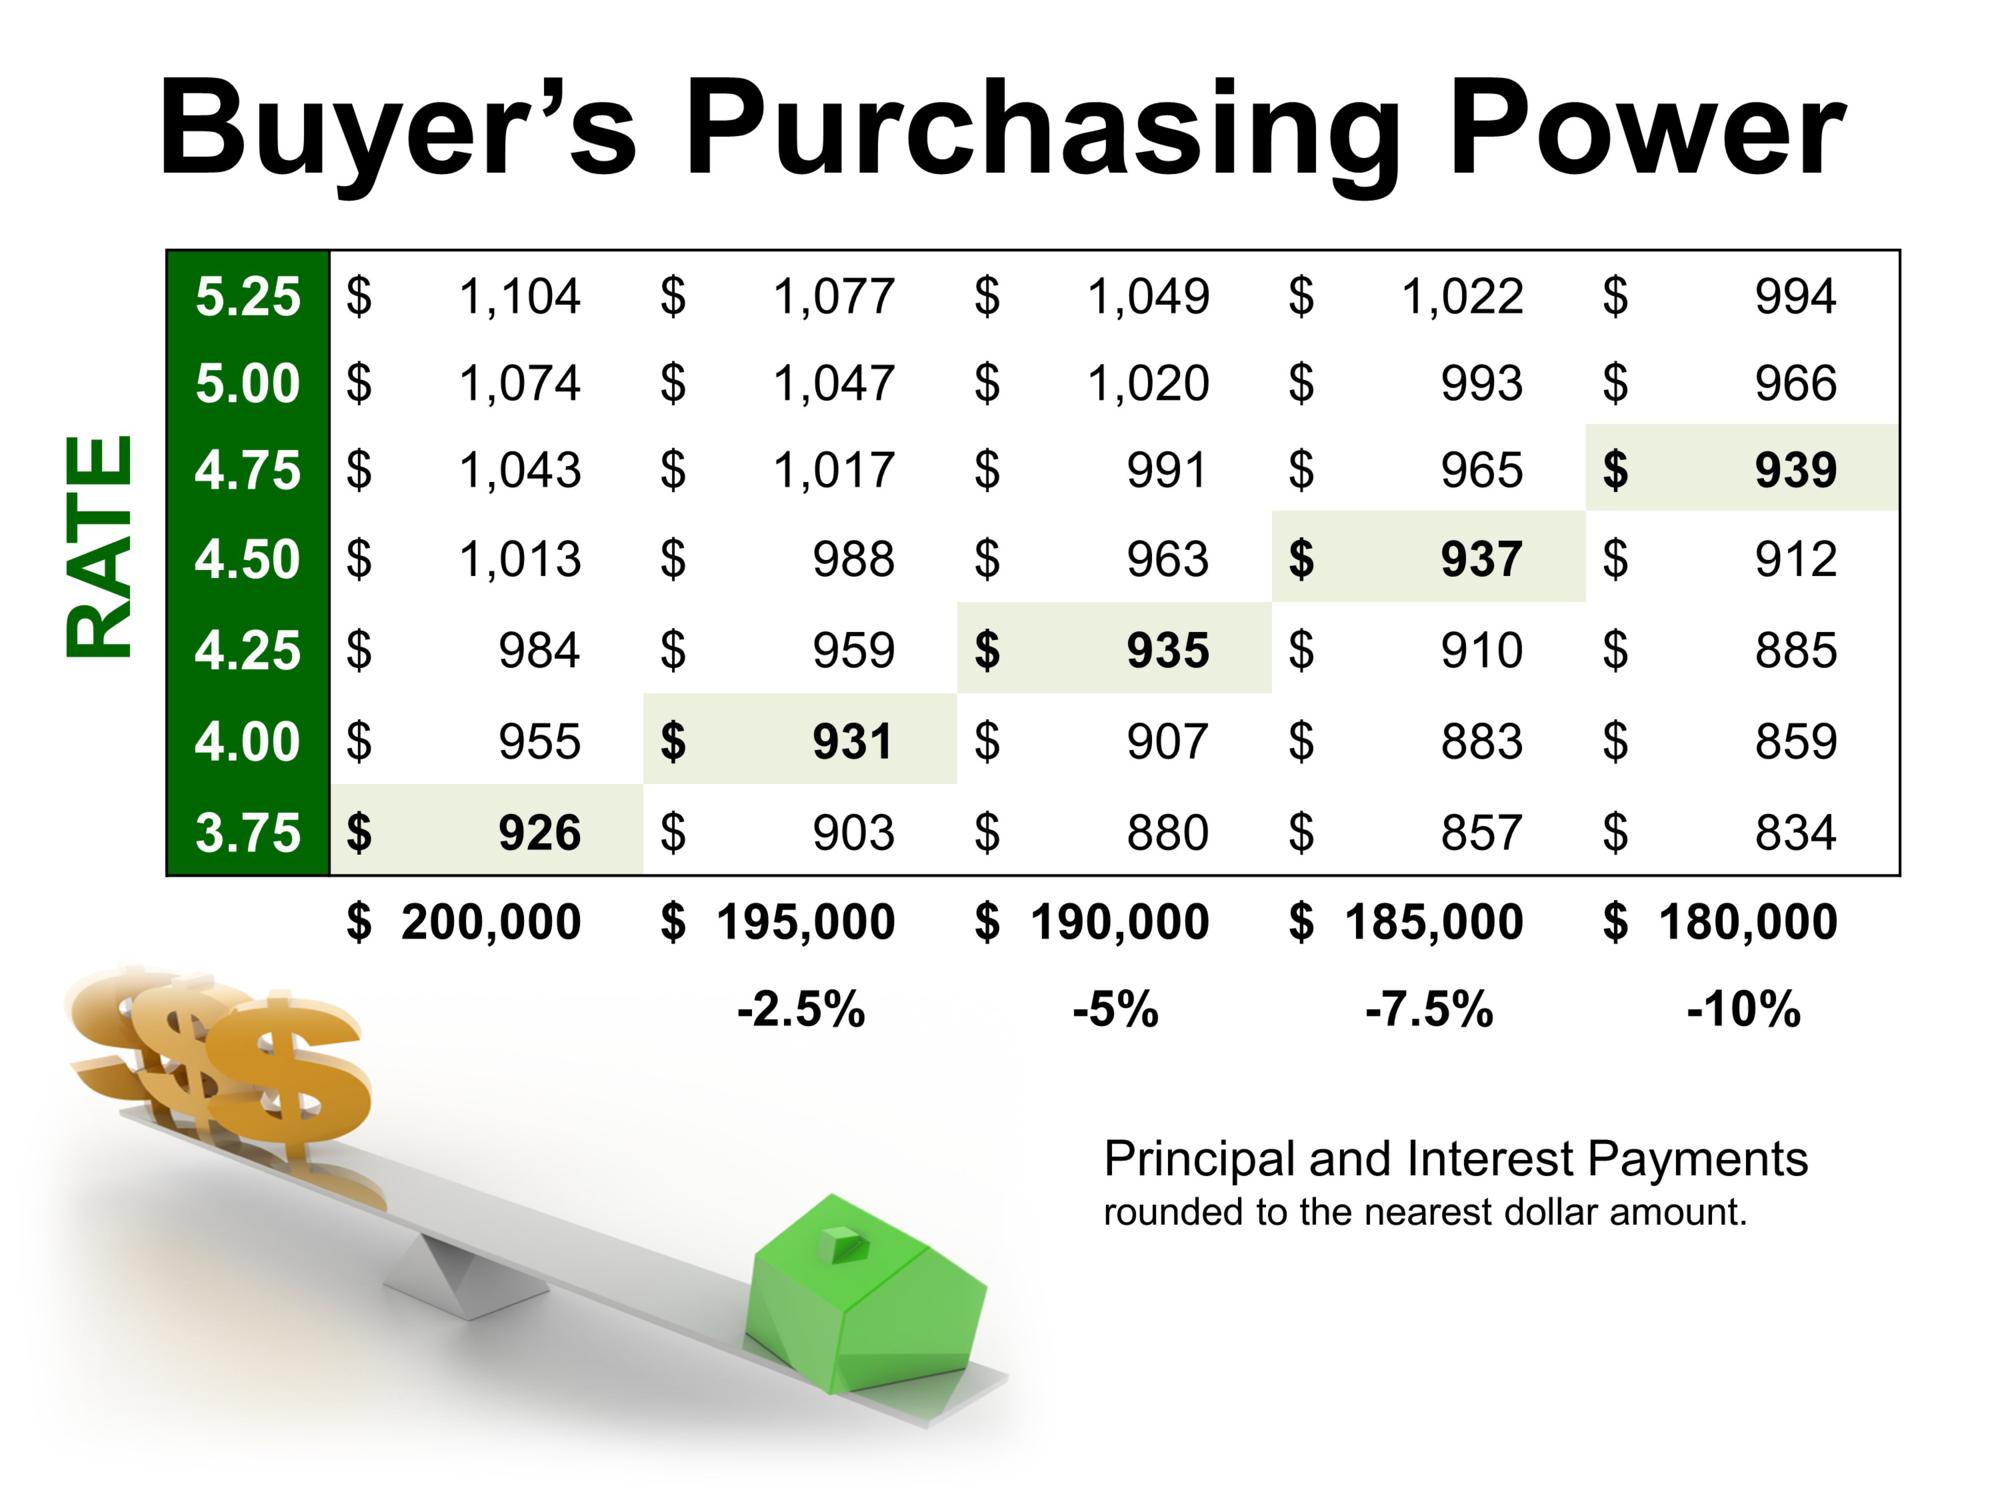
One bit of good news for buyers is the fact that down payment requirements have been relaxed, so you only need 3% down. (If you are military, you can still get a 0% down VA Loan).
For sellers, it is also a good market to sell. You do not want to try and time the market, so that you sell at the peak.
By many indications, the market is still heading for more growth and should continue that trend for a few more years. However, that is not set in stone. The smartest move is first making sure that you want to sell. Don’t simply list your house to “test the market”.
If you list, then you need to pay attention to what the numbers are telling us, and price your home accordingly from the start. This will ensure you get top dollar and get sold quickly–remember, the Average DOM in North Charleston is 66. In 2 months, you can be sold.
Buyers can search the North Charleston MLS and sign up to have a list of homes delivered directly to your inbox.
These homes will have prices, addresses, complete details and a link to Google maps. You will receive updated and new listings as well, so you will always know about the hottest deals as soon as they hit the market.
Sellers can check out my sellers page–make sure you hire the right agent to get your home sold, and not just listed!
Head over to my North Charleston Real Estate Stats page to keep up with the latest numbers.
Leave a Reply